Hello! Welcome to the first lesson in our new module, "Container Observability: Logging and Monitoring."
In the previous module, we focused on hardening your containers against security threats. We concluded by analyzing the significant risks of mounting the Docker socket. Now, we shift our focus from securing containers to observing them. The first and most fundamental pillar of observability is logging. When something goes wrong, logs are your first line of defense for troubleshooting.
Today's lesson is all about mastering the docker logs command. By the end of our session, you will be able to filter and format container logs using advanced 'docker logs' options. This skill is essential for efficiently debugging applications and understanding container behavior in any environment, from local development to production.
1. How Docker Captures Logs
Before we start filtering, it's important to understand what docker logs actually shows you. By default, Docker is designed to capture the standard output (stdout) and standard error (stderr) streams from the main process running inside a container.
This means that for Docker to see an application's logs, the application must be configured to write to these streams rather than to a file inside the container. Many modern applications and official Docker images are pre-configured to do this.
Let's look at a concrete example with Nginx, a very common web server you'll encounter.
Docker Logging - "docker logs" Command | Log Drivers | Logging Strategies
The video 'Docker Logging' from Better Stack provides an excellent technical walkthrough of how the official Nginx image is configured to forward its log files to stdout and stderr so that docker logs can capture them.
Watch from 06:36 to 09:04. Pay close attention to the use of symbolic links (ln -sf) inside the Dockerfile to redirect the access and error log files to /dev/stdout and /dev/stderr. This is a common pattern for containerizing traditional applications.
This setup ensures that any log entry written by Nginx is immediately picked up by the Docker daemon's logging driver, making it available via the docker logs command.
2. Viewing and Following Logs
The most basic use of the command is to retrieve all logs from a container by its name or ID.
To demonstrate, let's start a detached Nginx container. Run this in your terminal:
docker run -d -p 8080:80 --name webserver nginx
Now, if you visit http://localhost:8080 in your browser a few times, Nginx will generate some access logs.
To see them, you run:
docker logs webserver
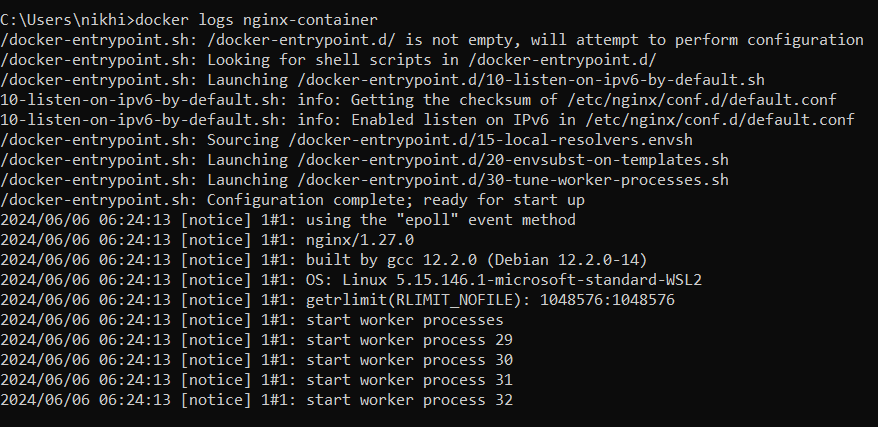
This command dumps the entire log history, which can be overwhelming for a long-running or busy container. More often, you'll want to see what's happening in real time. For this, you use the --follow (or -f) flag.
docker logs -f webserver
This will stream the logs to your terminal. However, it also prints the entire history first. A more effective pattern is to combine --follow with --tail to get a small amount of recent history for context, followed by the live stream.
docker logs -f --tail 50 webserver
This command shows the last 50 log lines and then streams any new logs. Press Ctrl+C to stop following.
3. Your Troubleshooting Toolkit: Advanced Filtering
When you're debugging an issue, you rarely need all the logs. You need the right logs. The docker logs command includes several powerful flags to help you zero in on the exact information you need.
Filtering by Time: --since and --until
These are arguably the most useful flags for investigating incidents.
--since: Shows logs generated after a specified time.--until: Shows logs generated before a specified time.
You can use relative times (e.g., 10m for 10 minutes, 3h for 3 hours) or absolute timestamps in RFC3339 format (e.g., 2023-10-27T10:00:00Z).
Let's see this in action.
Docker Logging - "docker logs" Command | Log Drivers | Logging Strategies
This segment from the 'Docker Logging' video demonstrates how to use --tail, --since, and --until to isolate logs within specific time windows.
Watch from 09:04 to 12:07. Notice how you can combine --since and --until to narrow down the search to a precise time frame, which is invaluable for correlating logs with specific events.
Here are some practical examples:
# Show logs from the last 15 minutes
docker logs --since 15m webserver

# Show logs from this morning, between 9:00 and 9:05 AM
docker logs --since 2023-10-27T09:00:00Z --until 2023-10-27T09:05:00Z webserver
Filtering by Content: Piping to grep
The docker logs command doesn't have a built-in option for text-based filtering, but you can leverage your Linux skills by piping its output to standard shell commands like grep. This is an extremely powerful and flexible technique.
Docker Logging - "docker logs" Command | Log Drivers | Logging Strategies
The same video quickly demonstrates how to pipe the output of docker logs to grep to find specific log entries.
Watch from 12:07 to 13:01. This shows a simple but effective way to search for all HTTP GET requests within the Nginx logs.
For instance, to find all requests that resulted in a 404 Not Found error in your Nginx logs, you could run:
docker logs webserver | grep " 404 "
Test your understanding!
You are investigating a performance degradation that users started reporting about 30 minutes ago. You suspect a specific API endpoint, /api/v1/heavy-query, might be the cause. The issue seems to have resolved itself in the last 5 minutes.
How would you construct a single command to find all log entries for this specific endpoint that occurred between 30 minutes ago and 5 minutes ago?
Show answer
You would combine time-based filtering with content-based filtering using a pipe:
docker logs --since 30m --until 5m webserver | grep "GET /api/v1/heavy-query"
This command first uses Docker to filter the logs to the relevant time window and then uses grep to search that smaller set of logs for the specific endpoint.
4. Formatting Log Output
Sometimes, the default log format isn't enough. You might need timestamps to correlate logs with events from other systems.
--timestampsor-t: Adds an RFC3339 timestamp to the beginning of each log line.--details: Shows extra attributes associated with the log, such as labels or environment variables passed to the logging driver.
# Show the last 10 log lines with timestamps
docker logs --timestamps --tail 10 webserver
The output will look something like this, which is much easier to parse chronologically:2023-10-27T14:30:15.123456789Z 172.17.0.1 - - [27/Oct/2023:14:30:15 +0000] "GET / HTTP/1.1" 200 615 "-" "..."
For a complete reference of all available options, the official Docker documentation is the best source.
The official documentation for docker container logs provides the definitive reference for all available flags and their usage.
Skim the 'Description' and 'Options' sections of this document. You don't need to memorize everything, but it's good to be aware of the full capabilities, such as the various date formats supported by --since.
5. Viewing Logs in Docker Compose
As you know from your experience, most projects use Docker Compose. The docker compose logs command works similarly to docker logs, but it aggregates logs from all containers that belong to one or more services.
Mastering Docker Logs: A Comprehensive Tutorial
The article 'Mastering Docker Logs: A Comprehensive Tutorial' has a great section on managing logs with Docker Compose.
Read the section 'Managing logs in Docker Compose'. It covers how to view logs for single or multiple services and confirms that all the filtering flags you just learned (--tail, --since, etc.) work here as well.
Key points for docker compose logs:
docker compose logs: Shows interleaved logs from all services.docker compose logs <service_name>: Shows logs for a specific service.- All the flags like
-f,--since, and--tailwork exactly the same way. --no-log-prefix: Use this flag to remove the service name prefix from each log line, which is useful for copying and pasting.
Conclusion
You've now equipped yourself with a powerful set of tools for navigating and understanding container logs directly from your terminal. Being able to quickly filter by time, content, and quantity is a crucial skill for any DevOps professional.
Key Takeaways:
- Docker captures
stdoutandstderrfrom containers. - Use
docker logs -f --tail <N>to stream recent and new logs. - Filter by time with
--sinceand--untilto investigate specific incidents. - Filter by content by piping the output to
grepfor powerful text-based searches. - Add timestamps with
-tfor better chronological analysis. docker compose logsextends these capabilities to multi-service applications.
While docker logs is excellent for real-time debugging and quick analysis, it's not a solution for long-term, centralized logging in a production environment. In our next lesson, we will address this by learning how to configure Docker logging drivers to automatically forward logs from all your containers to centralized systems like syslog or Fluentd.