Hello! Welcome to your next lesson in the "Performance Tuning and Optimization" module.
In our previous lesson, we dove deep into profiling CPU and memory usage, giving you the tools to understand why a container might be consuming host resources. We looked at everything from docker stats for a quick overview to perf for fine-grained function analysis.
Today, we shift our focus from computation and memory to another critical resource: the network. A slow network connection between containers can be a silent performance killer. This lesson is designed to help you achieve the learning outcome: Use network performance measurement tools like iperf to diagnose container networking bottlenecks.
As a DevOps engineer, you're likely familiar with troubleshooting network issues. Here, we'll apply that mindset to the containerized world, using Docker to create a controlled environment for measuring and analyzing network performance.
What is iperf3?
Before we start running commands, let's understand our primary tool: iperf3. It's a standard tool for active network performance measurement. It works on a simple client-server model: you run an iperf3 server on one machine (or container) and an iperf3 client on another. The client then sends data to the server, and iperf3 measures the throughput, jitter, and packet loss.

To get a more thorough introduction to iperf3 and its capabilities, the following video provides an excellent overview.
HOMELAB: A definitive guide to using iPerf3 to measure network performance! (Part 1)
This video, 'A definitive guide to using iPerf3 to measure network performance!' from Jeff's CTO Laboratory, provides a great introduction to what iperf3 is, its history, and why its client-server design is so flexible.
Watch the first 7 minutes and 24 seconds. Focus on understanding the core purpose of iperf3 and the key design feature that allows the client to control the type of test being run against a generic server.
Setting Up a Network Testbed with Docker
Now, let's get hands-on. We'll use Docker to create an isolated network and deploy our iperf3 server and client containers. This allows us to measure the performance of Docker's networking stack itself, without interference from other network traffic on the host.
We will follow the steps outlined in the article "How to Benchmark Docker Container Performance," which provides a clean and effective way to structure our test.
How to Benchmark Docker Container Performance
This article provides concise, practical examples for benchmarking various aspects of Docker performance. We will use its 'Network Benchmarking' section as our guide.
Focus on the commands in the subsection titled 'Using iperf3'. We will walk through these commands together in the text below.
Here's the step-by-step process:
1. Create an Isolated Docker Network:
First, we'll create a dedicated bridge network for our test. This ensures that our test containers can communicate with each other by name and are isolated from other containers.
docker network create bench-net
2. Start the iperf3 Server:
Next, we'll start the iperf3 server container. We'll use the popular networkstatic/iperf3 image.
docker run -d --name iperf-server --network bench-net networkstatic/iperf3 -s
Let's break down this command:
-d: Runs the container in detached mode (in the background).--name iperf-server: Gives our container a memorable name, which we'll use for the client connection.--network bench-net: Attaches the container to the network we just created.networkstatic/iperf3: The image to use.-s: The argument passed to theiperf3program inside the container, telling it to run in server mode.
3. Run the iperf3 Client:
Now, we'll run the client container to perform the test. It will connect to the iperf-server container by its name.
docker run --rm --network bench-net networkstatic/iperf3 -c iperf-server
--rm: Automatically removes the container when the test is finished. This is useful for one-off tasks.--network bench-net: Attaches this container to the same network as the server.-c iperf-server: This tells theiperf3program to run in client mode (-c) and connect to the host namediperf-server. Docker's networking provides the DNS resolution to make this work.
After a few seconds, you'll see the results of the test printed to your console.
Interpreting Test Results: TCP Throughput
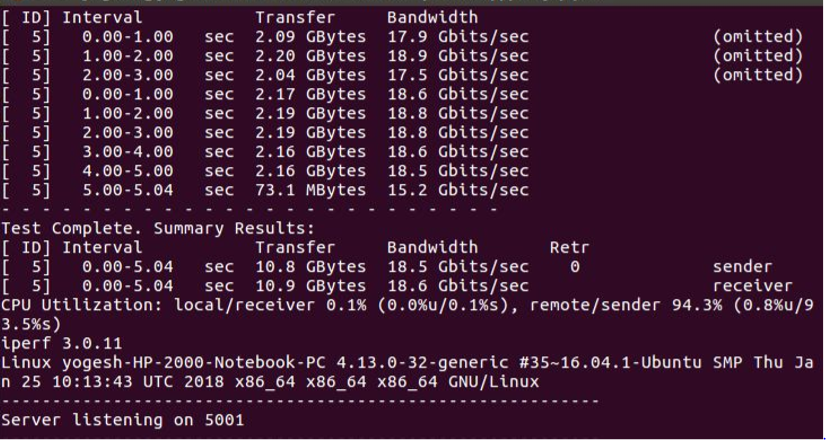
By default, iperf3 performs a TCP test, which measures the maximum achievable bandwidth. The output can be dense, so let's learn how to read it.
HOMELAB: A definitive guide to using iPerf3 to measure network performance! (Part 1)
Let's return to the video from Jeff's CTO Laboratory. This segment breaks down the output of a standard TCP test and introduces key options for changing the test's direction.
Watch from 07:24 to 11:30. Pay close attention to: How to read the sender and receiver summaries. The default test direction (client sends, server receives). The -R flag for a reverse (download) test. The --bidir flag for a bidirectional test.
Key parts of the output to check:
- Interval Reports: Lines showing transfer size and bitrate for each second of the test.
- Sender/Receiver Summary: The final block of text summarizes the entire test from both the sender's and receiver's perspective. The receiver's numbers are generally considered the most accurate measure of what was successfully delivered.
Test your understanding!
You have an iperf-server container running. You want to test the download speed from the server to the client, instead of the default upload speed. Write the full docker run command to accomplish this.
Show answer
You need to add the -R flag to the iperf3 command.
docker run --rm --network bench-net networkstatic/iperf3 -c iperf-server -R
Deeper Diagnostics: Using UDP to Find Packet Loss
While TCP tests are great for measuring raw throughput, they can hide underlying network problems because the TCP protocol is designed to retransmit lost packets. To diagnose issues like packet loss and jitter, we need to use UDP.
UDP tests with iperf3 are more manual but provide deeper insights.
HOMELAB: A definitive guide to using iPerf3 to measure network performance! (Part 1)
This final segment from Jeff's CTO Laboratory is essential for diagnostics. It explains the nuances of UDP testing, which is critical for identifying packet loss that TCP tests might obscure.
Watch from 13:18 to 19:23. This is a very important section. Focus on: The -u flag to switch to UDP mode. The -b flag to set the target bandwidth (and why it defaults to a slow 1 Mbit/s). How to read the Jitter and Lost/Total Datagrams fields—this is the most important part of the UDP output. Why you might see packet loss even on a seemingly perfect network when pushing at maximum speed (-b 0).
Key Takeaways for UDP Testing:
- Always specify bandwidth: Unlike TCP, you must tell the UDP client how fast to send data using the
-bflag (e.g.,-b 500Mfor 500 Mbits/sec). If you don't, it defaults to a very slow 1 Mbit/s. Use-b 0to send as fast as possible. - Focus on the loss report: The most valuable line in the UDP output is
Lost/Total Datagrams. A high loss percentage indicates a problem somewhere in the network path (e.g., congested switch, overwhelmed container network stack). - Jitter is key for real-time apps: Jitter measures the variation in packet arrival time. High jitter is particularly bad for applications like VoIP or video streaming.
Let's try a UDP test sending at 1 Gbit/sec:
docker run --rm --network bench-net networkstatic/iperf3 -c iperf-server -u -b 1G
Then, try to blast it as fast as possible and observe the packet loss:
docker run --rm --network bench-net networkstatic/iperf3 -c iperf-server -u -b 0
You will likely see a significant number of lost datagrams. This happens because the sending client is overwhelming the network stack buffers on the receiving side, causing it to drop packets. This is exactly the kind of bottleneck iperf3 is designed to help you find.
Practical Application: Comparing Network Driver Performance
Now let's use our new tool to answer a practical Docker question: what's the performance difference between the default bridge network and the host network?
The host network mode removes the network isolation layer between the container and the host, which should theoretically offer higher performance at the cost of security. Let's measure it.
The article "How to Benchmark Docker Container Performance" contains a handy script for this.
How to Benchmark Docker Container Performance
Let's revisit this article to see a practical script that automates the comparison between bridge and host network modes.
Find the shell script under the 'Compare Network Modes' subsection. You can copy and run this script directly on your machine to see the performance difference in your own environment.
When you run that script, you will almost certainly see that the host network provides significantly higher throughput. This is because it avoids the overhead of the network address translation (NAT) and virtual Ethernet pair (veth) used by bridge networks. This is a critical trade-off to understand when designing high-performance applications in Docker.
Conclusion
You've now learned how to use iperf3 within Docker to create a network performance testbed. This is a powerful capability for any DevOps engineer looking to diagnose and tune containerized applications.
Key Takeaways:
iperf3is a client-server tool for measuring network performance.- TCP tests (
-c) are best for measuring maximum bandwidth (throughput). - UDP tests (
-u -b <bandwidth>) are essential for diagnosing packet loss and jitter. - Running
iperf3inside Docker containers allows you to benchmark Docker's own networking stack. - Different Docker network drivers (e.g.,
bridgevs.host) have significant performance differences that you can now measure and quantify.
In our next lesson, we will build directly on this knowledge. Now that you can measure network bottlenecks, we will explore how to resolve them by applying network optimization techniques, such as choosing the appropriate network drivers for different use cases.