Hello! Welcome to your next lesson in the "Performance Tuning and Optimization" module.
In our last session, you learned how to put a leash on "noisy neighbor" containers by applying CPU and memory limits. This is a crucial skill for ensuring host stability. But what if you need to understand why a container is so resource-hungry in the first place? Simply capping its resources might just make it slow or cause it to crash.
Today, we'll equip you with the tools to look inside the container and profile its behavior. This lesson focuses on the learning outcome: Profile CPU and memory usage of a containerized application using standard Linux tools. As a DevOps engineer comfortable with the Linux command line, you'll find many of these tools familiar. The key will be learning how to apply them effectively in the context of container isolation.
The Challenge: Profiling in a Containerized World
Before we dive into commands, it's important to understand why profiling containers can be tricky. Containers use two key Linux kernel features:
- Namespaces: To isolate what a process can see (e.g., its own process tree, network interfaces).
- Control Groups (cgroups): To limit what a process can use (e.g., CPU, memory, I/O).
This isolation is what makes containers so powerful, but it can also make standard performance tools behave unexpectedly. For example, running top inside a container might show you metrics for the entire host, not just the container, which can be misleading.
To get a high-level overview of these challenges from a leading performance expert, watch the introduction to this talk by Brendan Gregg.
LISA17 - Linux Container Performance Analysis
This video, 'LISA17 - Linux Container Performance Analysis' by Brendan Gregg, starts by explaining the core problem: why analyzing container performance with standard Linux tools isn't always straightforward due to namespaces and cgroups.
Watch the first 2 minutes and 40 seconds of the video. Focus on understanding the conceptual difference between what container analysis should be and the practical challenges introduced by current implementations.
The First Look: docker stats
Your first and easiest tool for a real-time performance overview is docker stats. It's built into Docker and provides a live stream of the most critical metrics for all running containers.
This next video gives a quick, clear demonstration of the command.
Best Docker Container Monitoring Tools - Free and open source
The video 'Best Docker Container Monitoring Tools' begins with a practical look at docker stats, showing its output and basic options.
Watch from the beginning until 03:16. Pay attention to the meaning of each column in the output (CPU %, MEM USAGE / LIMIT, etc.) and the --no-stream option, which is useful for scripting.
The output of docker stats is a great starting point:
$ docker stats
CONTAINER ID   NAME          CPU %     MEM USAGE / LIMIT     MEM %     NET I/O           BLOCK I/O         PIDS
d2b8a36a9a3b   my-app        15.45%    123.4MiB / 2GiB       5.98%     1.25GB / 899MB    34.6MB / 0B       15
CPU %: The percentage of the host's total CPU capacity the container is using.MEM USAGE / LIMIT: How much memory the container is currently using versus its hard limit (which you learned to set in the last lesson).MEM %: The percentage of its memory limit that the container is using.
While docker stats is great for a high-level view, it doesn't tell you which processes inside the container are consuming the resources. For that, we need to go deeper.
Inside the Container: Using Standard Tools with docker exec
The most common way to profile a running container is to use docker exec to run commands inside its namespace. The pattern is simple: docker exec <container_name_or_id> <command>.
Let's look at a practical script that combines several tools to diagnose a CPU-hungry container.
Docker Performance Optimization: Real-World Strategies
The article 'Docker Performance Optimization: Real-World Strategies' provides a hands-on script for analyzing a container with high CPU usage. It demonstrates the power of combining docker stats with tools run via docker exec.
Read 'Scenario 1: The CPU-Hungry Container'. Focus on the 'Quick diagnosis script' and the explanation of what docker stats, top -bn1, and perf top each accomplish.
Let's break down that script:
docker stats --no-stream $container_id: Gets a single snapshot of the container's overall resource usage. This confirms if the container as a whole is the problem.docker exec $container_id top -bn1: This is the core of the internal investigation.topis the classic Linux process viewer.- The
-bflag runstopin "batch mode," making its output suitable for scripting or logging. - The
-n1flag tells it to run for one iteration and then exit.
This command gives you a list of processes running inside the container, sorted by CPU usage, so you can pinpoint the exact culprit.
docker exec $container_id perf top -a: This is a more advanced step.perfis a powerful Linux profiler.perf topcan show you which functions or system calls are consuming the most CPU cycles. This is invaluable when you need to hand off detailed performance data to a development team. Note: Runningperfmay require the container to have extended privileges (--cap-add=SYS_ADMIN).
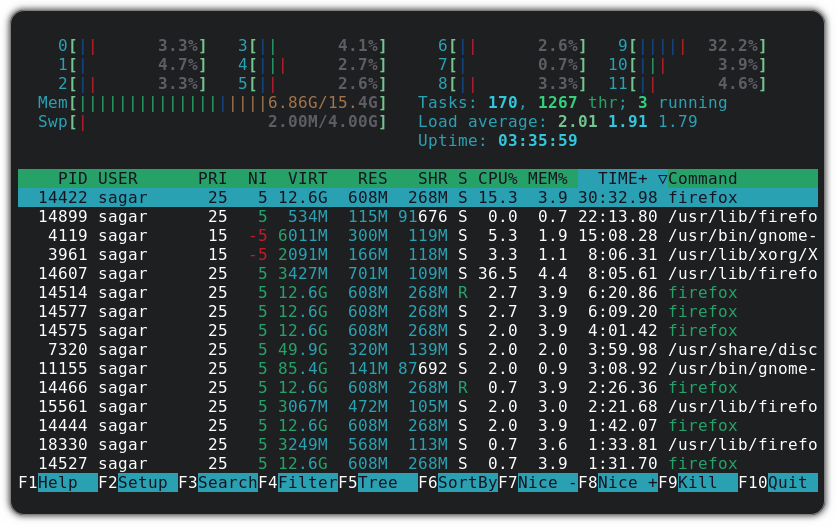
For interactive analysis, htop is often preferred over top for its user-friendly interface. You can run it the same way: docker exec -it <container_name> htop.
Test your understanding!
A container named data-processor is showing high memory usage in docker stats. You suspect a specific Java process inside it. Write a single command to view the processes inside the data-processor container, sorted by memory usage, without an interactive session.
Show answer
You can use top's batch mode and then pipe the output to sort it. A more direct way is to use the ps command.
docker exec data-processor ps -eo pid,user,%mem,%cpu,cmd --sort=-%mem
This command uses ps inside the container to list all processes (-e), formats the output to show relevant columns (-o ...), and sorts the results in descending order of memory usage (--sort=-%mem).
The Source of Truth: Digging into Cgroups
So where does docker stats get its data? It reads from the Control Group (cgroup) pseudo-filesystem, which is the kernel's mechanism for tracking resource usage. As a DevOps engineer, knowing how to read this data directly can be a powerful troubleshooting skill.
The Docker documentation explains how to locate these files and what they contain.
The official Docker documentation page 'Runtime metrics' explains how containers expose metrics through cgroups and how you can access this data directly from the host's filesystem.
Read the sections 'Control groups', 'Find the cgroup for a given container', 'Memory metrics: memory.stat', and 'CPU metrics: cpuacct.stat'. The goal is not to memorize the file paths, but to understand that for any container, there are files on the host (like cpuacct.stat and memory.stat) that hold the raw accounting data.
By inspecting files like /sys/fs/cgroup/memory/docker/<container-long-id>/memory.stat, you are looking at the same source data that docker stats uses. This is the lowest level of inspection and can be useful for building custom monitoring scripts or for diagnostics when higher-level tools fail.
Advanced Profiling from the Host
Sometimes, running tools inside the container isn't feasible, or you need to correlate its activity with the entire host. This is where host-level profiling comes in, but as Brendan Gregg mentioned, it has its challenges, like mapping host PIDs to container PIDs.
Modern tools and techniques help overcome this.
LISA17 - Linux Container Performance Analysis
Returning to Brendan Gregg's talk, this section demonstrates powerful host-to-container analysis techniques, including how Netflix profiles its containers.
Watch from 16:27 to 32:22. This is a dense and advanced section. Focus on these key concepts: The challenge of PID mapping between the host and container. The use of nsenter to run a command (like top) from the host as if it were inside the container's namespace. The use of the perf record --cgroup flag to profile only the processes belonging to a specific container's cgroup.
Two powerful techniques from the video are:
nsenter: A utility that lets you "enter" a process's namespaces. This allows you to run a tool liketopfrom the host but have it see the world from the container's point of view.perf record --cgroup: This is a fantastic feature for targeted profiling. By pointingperfat a container's cgroup path (which you learned about in the Docker docs), you can record performance data for only that container from the host, avoiding the noise of other processes.
A more user-friendly way to achieve a similar result for interactive tools like htop is to share the target container's namespaces when launching your tool.
# Run htop in a new, temporary container, but have it inspect
# the processes of 'target_container'
docker run --rm -it --pid container:target_container alpine htop
This command launches htop within a minimal alpine image but tells Docker to share the PID namespace of target_container. The result is that htop lists the processes of target_container, not its own. This is a clean, effective pattern for ad-hoc inspection.
Conclusion
You have now expanded your toolkit from simply limiting container resources to deeply understanding their consumption patterns. By profiling applications, you can provide targeted data to developers for code optimization, make more informed decisions about resource allocation, and ultimately build more efficient and stable systems.
Key Takeaways:
- Container profiling starts with
docker statsfor a high-level, real-time overview. - For detailed internal analysis, the
docker exec <container> <tool>pattern is your primary method.top -bn1,ps, andhtopare your go-to tools here. - The ultimate source of truth for resource metrics is the cgroup filesystem on the host, which can be read directly for advanced scripting and diagnostics.
- For advanced host-level analysis, you can use techniques like
perf record --cgroupfor targeted profiling ordocker run --pid container:...to run inspection tools in the context of another container.
In our next lesson, we will continue exploring performance optimization by looking at another common bottleneck: the network. You will learn how to use tools like iperf to measure and diagnose container networking performance.