Hello! Welcome to the second lesson in our "Performance Tuning and Optimization" module.
In our last lesson, we focused on building lean, efficient Docker images using multi-stage builds and minimal base images. Now that we have optimized images, the next logical step is to ensure they run harmoniously together. When you run multiple containers on a single host—a common practice in both development and production—they all compete for the same finite pool of CPU, memory, and I/O resources.
Today, we will tackle this challenge head-on. By the end of this lesson, you will be able to identify resource contention between containers using monitoring tools. We'll start with a built-in Docker command for quick checks and then explore a production-grade monitoring stack that is an industry standard for observability.
What is Resource Contention?
Resource contention is the "noisy neighbor" problem in the world of containers. It happens when one or more containers consume a disproportionate amount of system resources, slowing down or even crashing other containers on the same host. As a DevOps engineer, being able to spot and diagnose this is a critical skill for maintaining application performance and stability.
Part 1: Your First Responder: docker stats
The quickest and most direct way to get a real-time view of your containers' resource consumption is with the docker stats command. Think of it as the top command, but specifically for containers. It's an indispensable tool for immediate, on-the-spot health checks.
To understand how to use docker stats and interpret its output, please read the following sections from the article "Advanced Container Resource Monitoring with docker stats" on the Last9 blog.
Advanced Container Resource Monitoring with docker stats
This article provides an excellent, in-depth guide to the docker stats command. We'll start with the fundamentals.
Please read the sections 'What Is docker stats and Why Should You Care?', 'How to Use docker stats for Real-Time Container Monitoring', and 'Breaking Down docker stats Output: What Each Metric Means'. Pay close attention to the explanation of each column in the output, especially CPU % and MEM USAGE.
As you've read, docker stats provides a live-updating stream of key metrics. Let's highlight the most important ones for identifying contention:
CPU %: The percentage of the host's CPU being used. On a multi-core system, this can exceed 100%. A value of 200% means the container is fully utilizing two CPU cores. If one container is consistently high, it can starve others.MEM USAGE / LIMIT: The current memory usage versus the maximum allowed. If a container is constantly near its limit, it's under memory pressure. If no limit is set, it can consume host memory unchecked, affecting all other processes.NET I/O: The amount of data received and transmitted over the network. Sudden, massive spikes could indicate a network-intensive process or a potential issue.BLOCK I/O: The data read from and written to the host's storage. High disk I/O from one container can create a bottleneck for others that need to access the disk.
For a more terminal-friendly, interactive view similar to htop, many developers use tools like ctop.

Test your understanding!
You run docker stats and see the following output for two containers on a 4-core machine:
CONTAINER ID   NAME          CPU %     MEM USAGE / LIMIT   MEM %     NET I/O
a1b2c3d4e5f6   api-service   195.80%   1.8GiB / 2GiB       90.00%    1.5GB / 800MB
x9y8z7w6v5u4   db-service    5.25%     3.5GiB / 8GiB       43.75%    800MB / 1.5GB
Based on this, which container is likely causing performance issues for other applications on the host, and why? What are two signs of resource pressure visible in this output?
Show answer
The api-service container is the likely cause of contention.
- High CPU Usage: It's consuming 195.80% CPU, which is the equivalent of almost two full CPU cores. This intense usage can "starve" other processes on the host that need CPU time.
- High Memory Pressure: It's using 1.8GiB of its 2GiB limit (90.00%). This indicates it's operating near its memory ceiling, which can lead to performance degradation or even being terminated by the kernel's Out-Of-Memory (OOM) killer.
Part 2: Deeper Inspection with Troubleshooting Tools
docker stats tells you which container is using resources, but it doesn't tell you why. To find the specific process inside a container that's causing high CPU or memory usage, you need to look deeper.
One approach is to use docker exec to run commands like top or ps inside the container. A more powerful and elegant method, which aligns with the principle of keeping production images minimal, is to use a dedicated troubleshooting container.
The article below demonstrates this technique perfectly.
Docker Performance Optimization: Real-World Strategies
The article 'Docker Performance Optimization: Real-World Strategies' provides excellent, practical scripts for diagnosing performance issues.
First, review the script under 'Scenario 1: The CPU-Hungry Container' which uses docker exec ... top -bn1 to see processes inside a container. Then, look at the commands under '3. Resource Contention' in 'The Performance Troubleshooting Playbook' section. Notice how it uses a separate nicolaka/netshoot container with the --pid container:target_container flag to inspect another container's processes with htop.
The key takeaway here is the use of --pid container:<target_container>. This flag allows a temporary, tool-filled container (like netshoot) to share the process namespace of your running application container. This means you can use tools like htop to see all the processes of your application container without ever having to install htop in your application image, keeping it lean and secure.
Part 3: Production-Grade Monitoring with Prometheus & Grafana
For continuous, production-level monitoring, docker stats isn't enough. It provides no historical data, making it impossible to analyze trends, and offers no alerting capabilities. In a professional environment, you need a robust monitoring stack. The most popular open-source solution consists of:
- cAdvisor: Collects detailed resource usage metrics from containers.
- Prometheus: Scrapes and stores those metrics as a time-series database.
- Grafana: Queries Prometheus to create powerful, interactive dashboards for visualization.
This architecture allows you to see how resources are being used over time, correlate events, and set up alerts for when things go wrong.
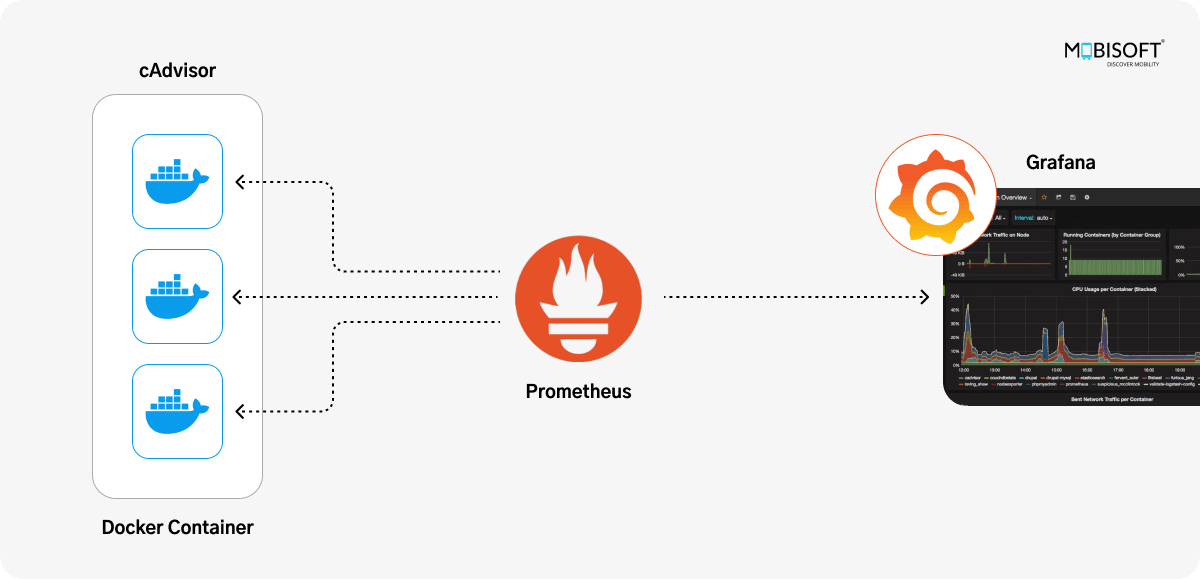
The following video gives a great overview of these components and how they work together.
Docker Container Monitoring Dashboards both Open Source and Netdata!
This video from VirtualizationHowto explains the role of each component in the monitoring stack and shows how to configure them with Docker Compose.
Watch the segment from 00:58 to 01:51, which clearly defines the purpose of cAdvisor, Node Exporter (for host metrics), Prometheus, and Grafana.
Now that you understand the roles, let's see the end result. The real power of this stack is the ability to visualize all your container metrics in one place. Setting up the stack can be time-consuming, but thanks to community-contributed dashboards, you can get valuable insights almost instantly.
This next video demonstrates exactly how to import a pre-built dashboard and use it to identify resource usage per container.
Monitor Docker Containers With cAdvisor, Prometheus And Grafana
This detailed walkthrough from Tech Tutorials - David McKone shows the final, most important step: using Grafana to visualize the data and pinpoint resource-hungry containers.
Please watch from 15:34 to 19:23. This section is crucial. It shows how to find a community dashboard for cAdvisor, import it into Grafana, and immediately get a dashboard that breaks down CPU and memory usage per container. The presenter specifically notes this is how you would identify which container is 'causing me the problem.' This directly addresses our learning goal.
With a dashboard like the one shown, you can see historical trends. For example, you could easily see if your api-service CPU usage spiked at the same time your db-service response time degraded. This ability to correlate events across services is what makes this kind of monitoring stack essential for troubleshooting complex microservice applications.
Conclusion
Today you've learned a tiered approach to monitoring container resources and identifying contention. You now have tools for every situation, from quick command-line checks to a full-blown production observability stack.
Key Takeaways:
- Resource contention is a common problem where containers on a shared host compete for CPU, memory, and I/O.
docker statsis the first tool to use for real-time, immediate resource usage statistics.- For deeper diagnosis of why a container is using resources, you can use
docker execor, preferably, a dedicated troubleshooting container with tools likehtopby sharing the process namespace (--pid). - For production monitoring, a stack like cAdvisor, Prometheus, and Grafana is the industry standard. It provides historical data and powerful dashboards, enabling you to visualize contention and correlate performance issues across your containers.
In our next lesson, we'll take the logical next step. Now that you can identify resource contention, you'll learn how to resolve resource contention by applying and tuning container resource limits. This will empower you not just to diagnose problems but to actively prevent them.