Welcome to the first lesson of our module on "Structuring and Presenting Data." In our previous module, we focused on cleaning and preparing your data, culminating in a powerful formula to standardize messy text. Now that your data is clean, the next logical step is to give it a proper structure. This will make it far more manageable, reliable, and ready for analysis and visualization.
This lesson introduces one of the most fundamental and powerful features in Excel: Tables. You'll learn what an Excel Table is, how it differs from a simple range of data, how to create one, and most importantly, how to leverage its dynamic features. Mastering Tables is a non-negotiable skill for building robust and automated solutions for your future clients.
What is an Excel Table?
You've likely created many "tables" in Excel by simply entering data into rows and columns and perhaps adding some borders and a background color. However, a formal Excel Table is something different. It's a special object that Excel recognizes, which unlocks a host of powerful features designed to make managing and analyzing your data easier and more reliable.
A simple range of data is static. If you add new data, your formulas and charts won't automatically include it unless you manually update their references. An Excel Table, on the other hand, is dynamic.
The article below provides a clear definition and a helpful visual comparison between a regular range and a formal Excel Table.
Excel table: comprehensive tutorial with examples
This tutorial from Ablebits.com provides a great introduction to Excel Tables.
Please read the first part of the article, from the beginning down to the section titled "What is a table in Excel?". Pay attention to the screenshot comparing a range to a table; this visual distinction is key.
Creating Your First Excel Table
Converting a range of data into a formal Table is straightforward. The most common method is to use the keyboard shortcut Ctrl+T.
Let's watch a demonstration of how to turn a standard data range into an Excel Table.
Only 1% of Excel Users Know Excel Tables! STAND OUT from the Crowd!
This video from MyOnlineTrainingHub provides an excellent walk-through of the process.
Watch the first part of the video from the demonstration. The presenter shows how to use both the Insert tab and the Ctrl+T shortcut.
As you saw in the video, the process involves these simple steps:
- Click any single cell inside your data.
- Press
Ctrl+Ton your keyboard. - A "Create Table" dialog box will appear, with Excel automatically suggesting the data range.
- Ensure the "My table has headers" box is checked if your data has a header row.
- Click OK.

Your data is now an official Excel Table, complete with formatting and filter buttons. But the real power lies in the dynamic features that have just been enabled.
The Power of Dynamic Ranges
The single most important feature of an Excel Table is its ability to automatically expand. When you add a new row of data immediately below the table, or a new column next to it, the table's boundaries automatically grow to include this new data.
This solves a huge problem for anyone building reports or dashboards. You no longer need to manually update formulas, charts, or PivotTables when new data arrives. The table handles it for you, ensuring your reports are always up-to-date and error-free.
The following video segment demonstrates this automatic expansion in detail.
Only 1% of Excel Users Know Excel Tables! STAND OUT from the Crowd!
Let's continue with the video from MyOnlineTrainingHub to see this dynamic behavior in action.
Watch the segment from this section, where the presenter adds new data and shows how the table's named range automatically updates. Then, jump to the part from the PivotTable example to see a direct application of this benefit.
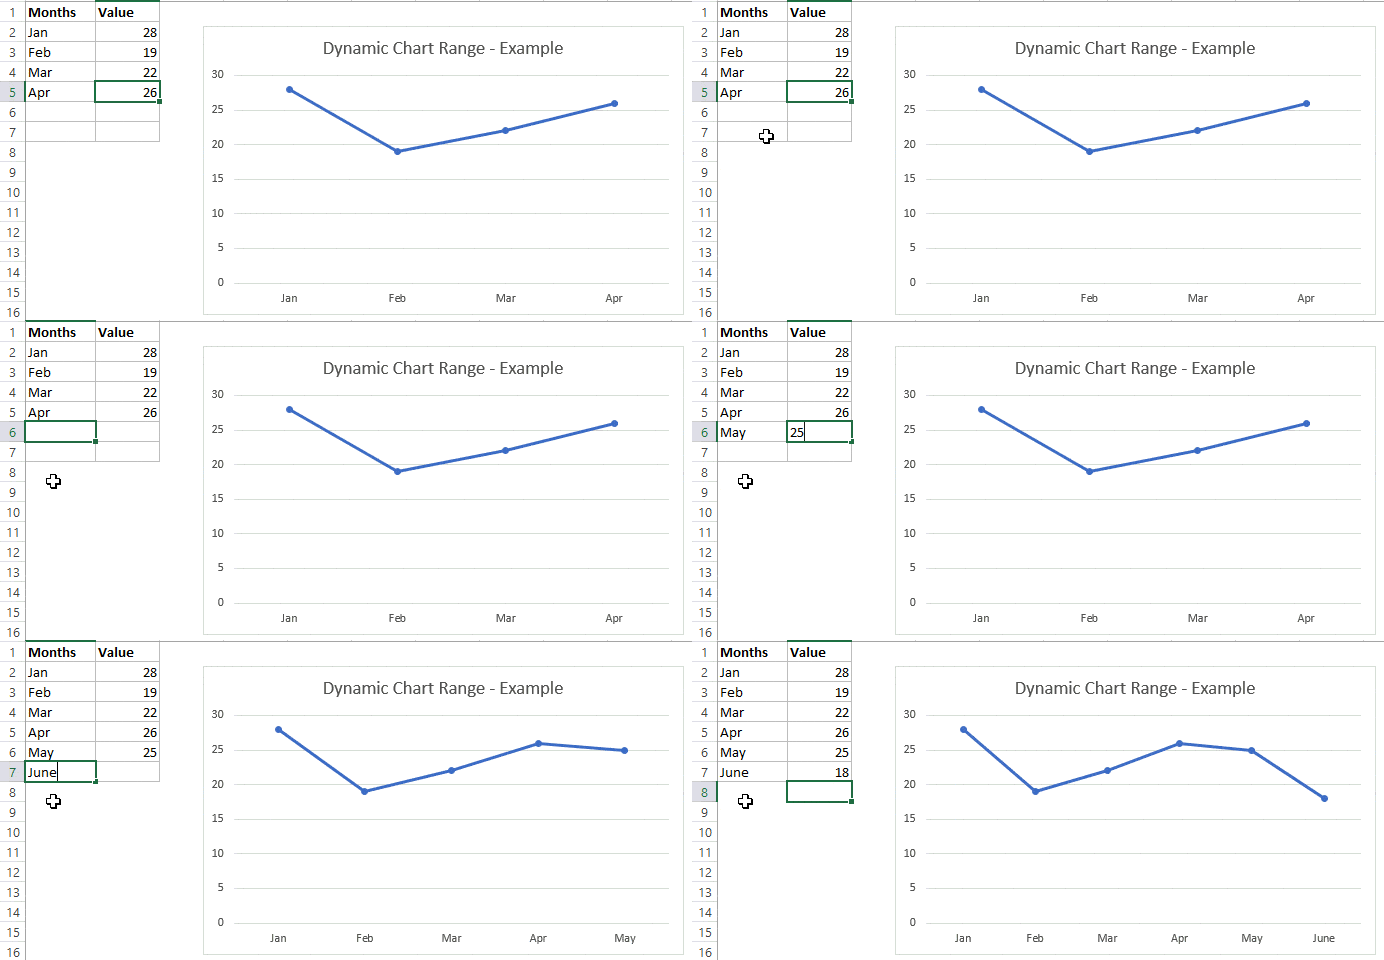
This dynamic nature is what allows for the creation of truly automated reports. Imagine you have a chart tracking monthly sales. If it's based on a Table, you simply add the new month's data, and the chart updates instantly, with no extra work required.
Other Key Table Features
Beyond automatic expansion, Tables come with several other built-in features that will save you time and effort.
- Easy Formatting: The
Table Designtab, which appears when you click inside a table, gives you a gallery of styles to format your data professionally with one click. - Total Row: With a single checkbox on the
Table Designtab, you can add a total row to the bottom of your table. This row can quickly calculate SUM, AVERAGE, COUNT, and more for any column, and it intelligently updates when you filter the data. - Built-in Filtering: Filter buttons are automatically added to each header, allowing for quick sorting and filtering without any extra setup.
- Sticky Headers: When you scroll down a large table, the column letters at the top of the worksheet are temporarily replaced by your table's headers, so you always know which column you're looking at.
Only 1% of Excel Users Know Excel Tables! STAND OUT from the Crowd!
Let's quickly see the Total Row feature.
Watch this short clip from this video to see how easily you can add and modify the Total Row for quick data aggregation.
For a comprehensive written summary of these benefits and more, the following article serves as an excellent reference.
Dynamic Excel Tables for Smarter Spreadsheets
This article from MyOnlineTrainingHub lists the key reasons for using Excel Tables. It's a great resource to bookmark for future reference.
Read the section 11 Reasons to Use Excel Tables. Focus on understanding benefits like "Automatic Expansion," "Built-In Total Row," and "Dynamic Ranges in Formulas."
Conclusion
In this lesson, you've taken a crucial step from simply holding data in a worksheet to actively structuring it for robust analysis. By converting a plain range into a formal Excel Table, you've unlocked a suite of dynamic features that automate updates, simplify calculations, and make your work more reliable. As a freelancer, building solutions on Tables instead of static ranges is a hallmark of professional, high-quality work.
Key Takeaways:
- An Excel Table is a special object, not just a formatted range of cells.
- The quickest way to create a table is with the
Ctrl+Tshortcut. - The primary benefit of a Table is its dynamic range, which automatically expands to include new rows and columns.
- This automatic expansion ensures that formulas, charts, and PivotTables based on the table are always up-to-date.
- Tables also offer valuable built-in features like the Total Row, easy styling, and persistent headers.
Now that you understand what a table is and why it's so powerful, our next lesson will focus on how to work with them. We'll explore structured references, the special, human-readable formula syntax that Tables enable. This will allow you to write formulas that are not only dynamic but also incredibly easy to read and maintain.