Introduction
In our last lesson, you did the essential work of building the engine for our financial model—projecting future revenues and expenses based on a set of clear, centralized assumptions. You now have a detailed, line-by-line forecast of the money coming in and going out. Today, we will assemble these individual parts into a coherent and powerful story of profitability.
This lesson focuses on consolidating those projections to calculate the key profit metrics that every business owner, investor, and client wants to see: Gross Profit, Operating Profit, and the all-important Net Income. By structuring our forecast into these standard tiers, we transform a simple list of numbers into a professional Profit & Loss (P&L) statement that reveals the financial health of the business at different levels. This is a fundamental step in building any credible financial model.
1. Gross Profit: The Profit from Core Operations
The first level of profitability we'll calculate is Gross Profit. This metric tells us how much profit a company makes from its core business of producing and selling its goods or services, before accounting for any general overhead or administrative costs.
The formula is straightforward:
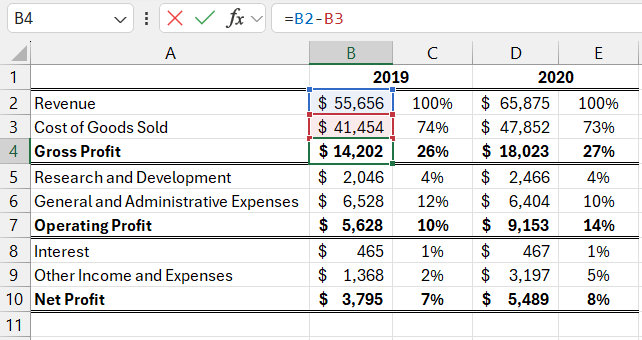
In a real-world model, you might have multiple revenue streams or cost components. A professional model often distinguishes between "Gross Revenue" and "Net Revenue" (which accounts for things like discounts or returns). The Cost of Goods Sold (COGS) is then subtracted from Net Revenue.
Let's watch a detailed demonstration of this process.
Build a Dynamic 3 Statement Financial Model From Scratch
This clip from "Build a Dynamic 3 Statement Financial Model From Scratch" by Kenji Explains walks through the top section of an income statement, from revenue down to Gross Profit.
Please watch the segment from gross revenue to gross profit. Pay close attention to these key steps: Net Revenue: Notice how Net Revenue is calculated first by summing Gross Revenue and any Discounts (which are negative). Total COGS: The individual cost items (Raw Materials, etc.) are summed to get Total COGS. Because these are costs, they are entered as negative numbers. Gross Profit: Observe the formula used: Gross Profit = Net Revenue + Total COGS. Because the COGS figure is already negative, adding it is the same as subtracting a positive number. This is a common and efficient modeling practice. Gross Profit Margin: The video also calculates the margin (Gross Profit / Net Revenue), a vital Key Performance Indicator (KPI).
2. Operating Profit (EBIT): Measuring Operational Efficiency
The next level down is Operating Profit, also commonly known as EBIT (Earnings Before Interest and Taxes). This metric shows the profit a company generates from its regular, ongoing business operations, after all operating expenses are paid. It's a key indicator of the company's core operational efficiency, as it excludes the effects of financing decisions (interest) and government taxes.
The formula builds directly on our previous step:
Operating Expenses (OPEX) are the fixed costs you projected in the last lesson, such as salaries, rent, and marketing.
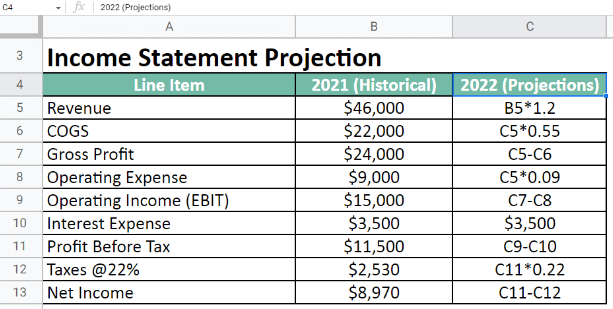
Let's see this calculated in a dynamic model.
Build a Dynamic Financial Model in Just 15 Minutes
This segment from Kenji Explains' "Build a Dynamic Financial Model in Just 15 Minutes" demonstrates the calculation of both Gross Profit and Operating Profit.
Please watch from Gross Profit to Operating Profit. You've already seen the Gross Profit calculation, so focus on how Operating Profit is calculated by subtracting the Total Operating Expenses from the Gross Profit.
A Note on EBITDA
You will frequently encounter another metric called EBITDA (Earnings Before Interest, Taxes, Depreciation, and Amortization). It is calculated by taking Operating Profit (EBIT) and adding back the non-cash expenses of Depreciation & Amortization. For a freelance analyst, it's important to understand why this is used. The following short clip provides an excellent explanation.
Build a Dynamic 3 Statement Financial Model From Scratch
This part of the "3 Statement Model" video offers a concise explanation of EBITDA's purpose.
Please watch the clip from explaining EBITDA. The key takeaway is that EBITDA allows for a fairer comparison of the core profitability of two companies by removing differences in their financing structure (interest), tax jurisdiction (taxes), and capital expenditure policies (D&A).
3. Net Income: The Bottom Line
Finally, we arrive at the "bottom line": Net Income. This is the company's total profit after all expenses, including interest on debt and corporate taxes, have been deducted from revenue.
The calculation follows logically from EBIT:
- Subtract Interest Expense to get Profit Before Tax (PBT), also called Earnings Before Tax (EBT).
- Calculate and subtract Taxes to arrive at Net Income.
While this seems simple, modeling the tax calculation requires a bit of conditional logic, because a company typically only pays taxes if it has a profit. This is a perfect opportunity to apply the IF function you learned in Module 1.
Build a Dynamic Financial Model in Just 15 Minutes
This final clip from the "15-Minute Model" video demonstrates a professional way to handle the tax and Net Income calculations.
Watch this segment from calculating taxes and net income. Note the clever use of an IF statement: The Test: The formula checks if the operating profit is less than zero (i.e., a loss). If True (a loss): It returns "N/A", indicating no tax is applicable. A common alternative is to simply return 0. If False (a profit): It calculates the tax by multiplying the operating profit by the tax rate assumption. Final Calculation: Net Income is then calculated. Notice the use of another function (IFERROR) to correctly show the loss in the first year without generating an error. This is a great example of building a robust formula.
4. Structuring the Final P&L Statement
You have now calculated all the key profit tiers. The final step is to put them together in a clean, professional P&L structure. In the previous lesson, you created separate projection lines for various revenues and costs. Consolidation simply means adding summary rows at the appropriate places to calculate Gross Profit, Operating Profit, and Net Income.
The following resource shows exactly how to add these final summary rows to complete the P&L.
Build a Profit & Loss Statement in Excel: Practical Guide
This guide from Accelerate Excel shows how to build a P&L from raw data. We will focus only on the final step of structuring the statement with summary rows.
Please read the following parts of the guide: First, review the image under the heading Aggregated P&L. This is the standard, easy-to-read structure we are aiming for, with revenue at the top, followed by subtotals for Gross Profit, EBIT, and Net Income. Next, read the instructions in Step 3: Finalize the P&L, focusing specifically on the subsection "Add subtotal rows". This section provides the practical "how-to" for consolidation: inserting blank rows and using simple SUM formulas to total the relevant sections above them. This is the action that turns your detailed projections into a summarized P&L.
By following these steps, you will have successfully transformed your raw forecasts into a complete, professional, and easy-to-understand Income Statement.
Conclusion
Today, you have taken the detailed revenue and expense projections from our previous lesson and consolidated them into a structured Profit & Loss statement. This process of creating tiers of profitability is fundamental to financial modeling and analysis.
Key Takeaways:
- Gross Profit () reveals profitability from the core business of making and selling.
- Operating Profit/EBIT () measures the efficiency of the company's main operations.
- Net Income () is the final "bottom line" profit after all costs are accounted for.
- Consolidation in Excel is achieved by inserting summary rows and using
SUMformulas to group the projected revenue and cost lines into the standard profit tiers. - Robust models use conditional logic. Using an
IFstatement to calculate taxes only on profits makes your forecast more realistic and professional.
In our next lesson, we will expand our financial modeling toolkit beyond the P&L. We will delve into the Time Value of Money, using Excel's powerful functions like PMT, PV, and FV to analyze loans, savings, and investments—essential skills for evaluating financial decisions for your future clients.