Introduction
In our last lesson, we laid the foundation for our financial model by designing its architecture around the I-C-O principle: separating Inputs, Calculations, and Outputs. You learned why a dedicated assumptions section is the cornerstone of any robust, flexible model that a client can trust and you can easily update.
Today, we move from architectural design to active construction. We will bring our model to life by building the engine of any forecast: the revenue and expense projections. You will learn how to create dynamic formulas that project a company's financial future, with every calculation directly linked back to the assumptions section we designed. This is a fundamental skill for any freelance financial modeling work, transforming a static spreadsheet into a powerful forecasting tool.
1. The Core Drivers of a Forecast
Before we write any formulas, let's establish the basic logic. A financial forecast is simply a mathematical representation of a business's operations. At its simplest, this can be broken down into three core components, which are clearly defined in the following resource.
2.2 Modeling Revenue, Costs, and Profit
This text from an Open Text project at the University of Lethbridge provides the fundamental equations for modeling a business.
Please read the following three short subsections to understand the basic formulas we will be implementing: Revenue: Start at Subsection 2.2.1. The key takeaway is the basic formula: \text{Revenue} = \text{Quantity} \times \text{Price}. Cost: Continue to Subsection 2.2.2. Note the distinction between fixed costs (rent, licenses) and variable costs (materials, cost per sale). Our total cost function will be: \text{Cost} = \text{Fixed Costs} + (\text{Variable Costs} \times \text{Quantity}). Profit: Finally, read the brief Subsection 2.2.3, which introduces the final piece: \text{Profit} = \text{Revenue} - \text{Cost}.
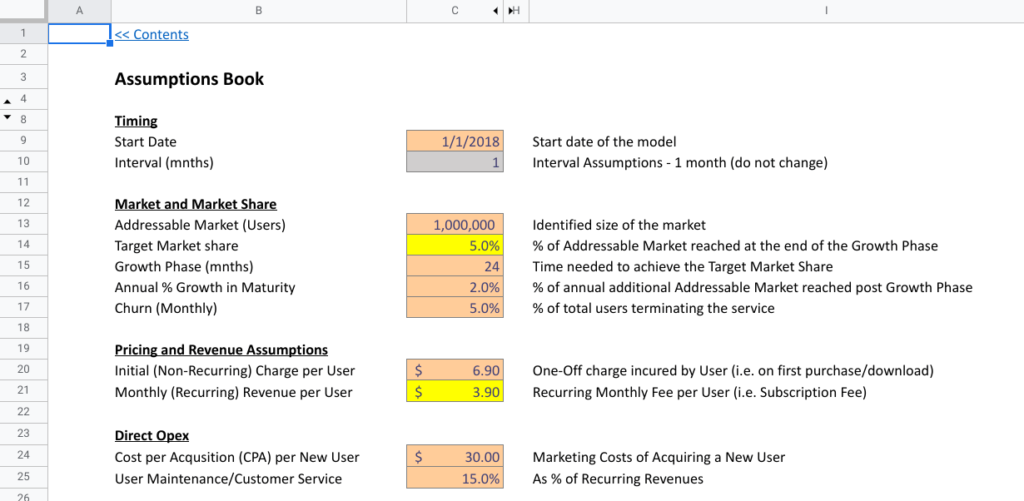
These three equations are the "physics" of our model. The variables within them—quantity, price, fixed costs, and variable costs—are called drivers. Our assumptions section is where we will define and control these drivers.
2. Building the Revenue Forecast
With the theory in place, let's start building. Our first task is to project revenue. We will do this by defining our drivers (e.g., number of orders, price per order, and growth rate) in the assumptions section and then using formulas in the main statement to calculate the revenue for each forecast period.
The following video provides a clear, practical demonstration of this process.
Build a Dynamic Financial Model in Just 15 Minutes
This clip from the "Build a Dynamic Financial Model" video by Kenji Explains shows exactly how to build a revenue forecast linked to assumptions.
Please watch the segment from the start to the revenue calculation. As you watch, focus on the three distinct steps: Defining Assumptions: Notice how 'Number of Orders', 'Average Order Value', and 'Order Growth Rate' are all laid out in an assumptions area at the bottom. Projecting a Driver: See how the 'Number of Orders' is forecast forward using the formula: Previous Year Orders * (1 + Growth Rate). Calculating Revenue: Observe how the 'Revenue' line in the income statement is calculated by multiplying the projected drivers: Number of Orders * Average Order Value.
This process creates a dynamic link. If you change the 'Order Growth Rate' in the assumptions, the 'Number of Orders' and, consequently, the 'Revenue' will update automatically. This is the flexibility clients pay for.
The "Financial Forecasting Guide" from the Corporate Finance Institute reinforces this with explicit formulas. For a year-over-year growth model, the formula for the first forecast year's sales is:
=C42*(1+D8)
Where C42 is the previous year's sales and D8 is the sales growth assumption. This is precisely the logic applied in the video.
3. Building the Expense Forecast
Next, we'll forecast the costs. As we learned from our reading, costs come in two main flavors: variable and fixed.
- Variable Costs are often grouped into the Cost of Goods Sold (COGS). These costs scale directly with revenue or quantity. For example, the cost of manufacturing a t-shirt is incurred for every t-shirt sold.
- Fixed Costs are typically called Operating Expenses (OPEX) or SG&A (Selling, General & Administrative). These are the costs of being in business, regardless of sales volume, such as rent, salaries, and marketing budgets. In reality, these can change over time (e.g., hiring more staff as you grow), so we model them as "steps" in our forecast.
Let's return to the video to see how to model both types.
Build a Dynamic Financial Model in Just 15 Minutes
This next segment demonstrates how to forecast both variable and fixed expenses and link them into the main financial statement.
Please watch the following two clips: First, watch the section on defining expense assumptions. Note how variable costs ('Manufacturing', 'Order Fulfillment') are defined on a per-order basis, while fixed costs ('Warehouse Rent', 'Salaries') are set as fixed dollar amounts that can be adjusted in future years. Next, see how these are linked in the income statement from linking assumptions to the income statement. Pay close attention to the formulas used: Variable Costs: Number of Orders * Manufacturing Cost Per Order Fixed Costs: A direct link, like =C15, where C15 is the salary assumption for that year.
An Alternative Method: Percentage of Sales
Another extremely common method for forecasting expenses, especially SG&A, is to assume they will represent a certain percentage of sales. This is particularly useful when you don't have detailed per-unit cost information but have historical data suggesting a stable relationship between sales and expenses.
The CFI "Financial Forecasting Guide" provides the perfect formula for this. To calculate an expense line like "Distribution Expenses" as a percentage of sales, you would use:
=D$42*D10
Here, D$42 refers to the Sales for the current period, and D10 refers to the assumption for "Distribution Expense as a % of Sales". The dollar sign $ creates a mixed reference. As you drag this formula down to calculate other expenses (like Marketing or Depreciation), the reference to the expense assumption (D10) will change, but the reference to the sales row ($42) will remain locked. This is an efficient technique you learned about back in Module 1.
4. Putting It All Together
You have now built the core components of your forecast: a revenue projection and an expense projection, both dynamically driven by a centralized assumptions section. Your simplified income statement structure might now look something like the example below, with each of the forecast numbers being the result of a formula.

By following the principles from today's lesson, you have created a model where you can ask "what-if" questions simply by changing a number in the assumptions section and watching the entire forecast update instantly.
Conclusion
Today you've transitioned from architect to builder, putting the structural theory from our last lesson into practice. You've constructed the essential revenue and expense forecasts that form the engine of a financial model, ensuring every projection is traceable to a clear assumption.
Key Takeaways:
- Forecasts are built on drivers: Revenue and expenses are driven by key business variables like quantity, price, and costs, which are defined in your assumptions section.
- Revenue Forecasting: A common method is to project a primary driver (like
Number of Orders) based on a growth rate, then multiply it by a secondary driver (likePrice per Order). - Expense Forecasting: Costs are separated into variable (COGS), which scale with quantity, and fixed (OPEX), which are modeled as fixed amounts that can step up over time. Forecasting expenses as a percentage of sales is also a powerful technique.
- Dynamic Linking is Key: The power of a financial model comes from using formulas to link your outputs (the forecast) to your inputs (the assumptions), creating a flexible and auditable tool.
In our next lesson, we will complete our initial financial statement. With revenue and expenses forecasted, we will consolidate these projections to calculate essential profit metrics like Gross Profit, EBITDA, and Net Income, giving us a full top-to-bottom view of the company's projected profitability.