Introduction
In our last lesson, we constructed a detailed loan amortization schedule, a powerful tool for understanding the lifecycle of a loan. That model, however, was based on a fixed set of assumptions—a specific loan amount, interest rate, and term. In the real world, these variables are rarely certain. This is where financial modeling becomes a tool for exploration and decision-making.
Today, we will learn how to perform sensitivity analysis. This technique allows us to see how the outputs of our model (like the monthly payment or total interest paid) change when one or two key inputs vary. For this, we will use one of Excel's most effective What-If Analysis tools: the Data Table. Mastering this will enable you to build more dynamic and insightful models for your future clients, helping them understand risks and opportunities by answering questions like, "What if interest rates rise?" or "How does the loan term affect my total cost?"
1. The Foundation of Sensitivity Analysis
Sensitivity analysis works by systematically substituting a range of values into one or two input cells in your model and then summarizing the impact on a key output. For this to work, your spreadsheet must be set up correctly.
The core requirement is that your output cell must be connected to your input cells through formulas. Our loan amortization schedule is a perfect example: the monthly payment (output) is calculated using the PMT function, which directly references the interest rate, loan term, and loan amount (inputs). If you change the interest rate, the payment amount automatically updates.
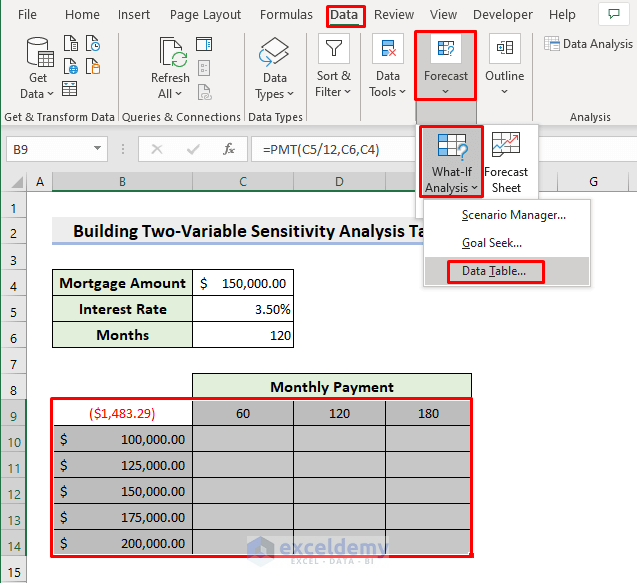
Data Tables automate the process of changing the input and recording the output, presenting the results in a clean, easy-to-read table. You can find this feature under the Data tab, in the What-If Analysis dropdown menu.
2. One-Variable Data Tables
A one-variable data table allows you to see how changing a single input affects one or more outputs. Let's use our loan model to answer the question: "How does our monthly payment change if the interest rate varies from 4% to 8%?"
To build a one-variable data table, you follow these general steps:
- Create a column of input values. These are the different interest rates you want to test (e.g., 4.0%, 4.5%, 5.0%, etc.).
- Link to the output formula. In the cell to the right of your first input value and one row above, create a direct link to the cell that calculates your output (e.g., the cell containing the
PMTformula). - Select the range. Highlight the entire table, including both your column of inputs and the linked output cell.
- Open the Data Table tool. Go to
Data > What-If Analysis > Data Table. - Specify the input cell. Because your variable inputs are in a column, you will use the Column input cell field. In this field, you must select the original input cell that your model's formula depends on—in this case, the single cell where you defined the annual interest rate for your loan schedule.
Excel will then, one by one, substitute each value from your input column into the specified "Column input cell," recalculate the model, and display the resulting monthly payment in the corresponding row of your data table.
The following video provides a clear demonstration of this process using a retirement savings example. The principle is exactly the same for our loan model.
Excel What-If Analysis Data Table | Easy to Use Once you Learn This☝️
This video from Leila Gharani offers an excellent introduction to creating a one-variable data table.
Please watch the first two sections of the video: Introduction to the model: This part sets up a simple financial model using the FV function. Notice how the final output is dependent on several inputs. Creating a one-variable table: Pay close attention to the setup. See how the different interest rates are listed in a column and how the FV formula is linked at the top. Critically, notice which cell she selects for the "Column input cell"—it's the original interest rate cell from the model, not any part of the new table.
As the video shows, the result is a table that instantly shows you the future value at various interest rates. You can apply this exact same logic to your loan amortization model to see how the monthly payment changes with the interest rate.
3. Two-Variable Data Tables
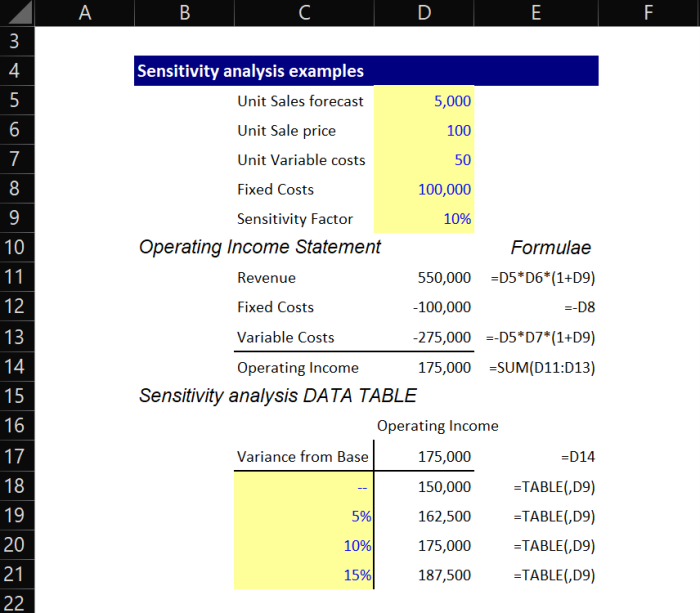
Often, you'll want to understand the combined effect of two changing variables. For example: "How does my monthly payment change if both the interest rate and the loan term vary?" For this, we use a two-variable data table.
The setup is slightly different:
- Create a row and a column of input values. One variable (e.g., loan term in years) goes across the top row. The other variable (e.g., interest rate) goes down the first column.
- Link to the output formula. This is the most important step. In the top-left corner cell of the table, at the intersection of the row and column headers, create a direct link to your output cell (the
PMTcalculation). - Select the range and open the Data Table tool.
- Specify both input cells. This time, you will fill both fields in the dialog box:
- Row input cell: Select the original input cell for the variable in your table's top row (e.g., the loan term cell in your model).
- Column input cell: Select the original input cell for the variable in your table's left column (e.g., the interest rate cell in your model).
Excel will then iterate through every possible pair of inputs, calculating the monthly payment for each combination.
The following video demonstrates this using a business profitability model, which is a great way to see how this powerful tool can be applied in different contexts.
Sensitivity Analysis Using Excel | One and Two Variable Data Tables
This video by Chester Tugwell provides a clear walkthrough of building a two-variable data table.
Please watch the section from creating a two-variable table. Observe the structure carefully: selling price in the column, units sold in the row, and the net profit formula linked in the top-left corner. Notice how he correctly identifies the "Row input cell" and "Column input cell" by linking back to the original model's inputs.
4. Pro Tips for Building Professional Data Tables
As you build these for clients, a few professional touches can make your work more robust and easier to understand.
Evaluating Multiple Outputs
A one-variable table can actually evaluate multiple outputs at once. To do this, simply link to additional output formulas in the cells to the right of your first linked formula in the header row. For example, you could see how both the Monthly Payment and the Total Interest Paid change as the interest rate varies. The video from Chester Tugwell demonstrates this technique for net profit and gross profit.
Watch from
Improving Readability
The linked formulas in the header cells of a data table can look messy. A great trick is to use custom number formatting to display a clean text header while keeping the underlying formula link intact.
The same video shows exactly how to do this from
Managing Performance
Data tables are calculation-intensive. In a large model, they can slow Excel down because they recalculate every time any cell changes. To prevent this, you can change Excel's calculation settings.
How to make and use a data table in Excel
This section from Ablebits.com explains how to control when data tables are updated.
Please read the section titled "How to recalculate data table manually". This shows you how to set calculation to "Automatic Except Data Tables". When this is active, you can simply press the F9 key to force an update whenever you're ready.
Finally, it's crucial to remember the ground rules for creating data tables. The following reading summarizes the key requirements and common pitfalls.
Sensitivity Analysis Excel: Tutorial, Video, and Template
This article from Breaking Into Wall Street provides a concise summary of the essential rules for building sensitivity tables.
Read the section titled "Key Requirements to Set Up the Tables". Pay close attention to the 6 numbered points, as they cover the most common errors users make.
Conclusion
You have now learned how to extend a static financial model into a dynamic analytical tool. By using one- and two-variable Data Tables, you can explore the impact of uncertainty and provide much deeper insights than a single-answer calculation can offer. This is a fundamental skill in financial modeling and a key step toward building the sophisticated, client-ready solutions you aim to create.
Key Takeaways:
- Sensitivity analysis helps quantify the impact of changing assumptions in a model.
- Excel's Data Table feature automates this analysis for one or two variables.
- A one-variable table tests a column (or row) of input values against one or more outputs.
- A two-variable table tests pairs of inputs from a row and a column against a single output.
- The correct setup is critical: your model must be formula-driven, and you must correctly link the
Row/Column input cellfields back to the original model inputs. - For professional use, manage performance by setting calculations to "Automatic Except for Data Tables" and use formatting tricks to improve readability.
In this lesson, we changed inputs to see how the output would be affected. In our next lesson, we will flip this logic on its head. We will use Goal Seek and Solver to find the specific input required to achieve a desired output, a technique essential for problem-solving and optimization.