Introduction
Welcome to the final lesson in our Power Query module. In our last session, we delved into the M language, the script that Power Query writes to record all of your transformation steps. Now that you understand how to connect to data and how to clean and shape it, we've arrived at the last crucial piece of the puzzle: loading that transformed data back into Excel.
This lesson will focus on the "Load" part of the "Connect, Transform, Load" workflow. You will learn the different ways you can bring your query results into your workbook, from a simple table on a worksheet to the more powerful Excel Data Model. We'll also cover how to manage your query's refresh settings to ensure your analysis is always based on the most up-to-date information. Mastering these loading and refresh options is the final step in preparing your data for analysis and reporting.
1. Close & Load: Choosing Your Data's Destination
Once you've finished your transformations in the Power Query Editor, you need to tell Excel what to do with the output. The Home tab in the editor gives you two main choices under Close & Load:
- Close & Load: This option uses the default setting to load your data. Typically, this means loading the data as a new Excel Table in a new worksheet.
- Close & Load To...: This is the more powerful option. It opens the Import Data dialog box, giving you precise control over where and how your data is loaded.
Since your goal is to build professional and efficient solutions, you'll almost always want to use Close & Load To... to be deliberate about your choices.
Let's explore the options this dialog box presents.
Get to know Power Query Close & Load options
This article from Excel Off The Grid provides a great overview of the "Import Data" dialog box and the strategic choices you can make.
Please read the first three sections of the article: Start from the beginning and read down to How to view the query output. This section introduces the different formats for your query result: Table, PivotTable Report, PivotChart, and Only Create Connection. Pay close attention to the description of "Only Create Connection"—it's a critical concept for managing complex workbooks. Continue with the next section, Where to put the query output. This explains how to place your data in a new or existing worksheet. Finally, read the section Add to the Data Model. This will give you a first look at the Data Model and why it's so important.
To summarize the key loading destinations:
- Table: This is the most straightforward option. It places your data in a standard Excel Table on a worksheet, where you can see it and interact with it directly.
- Only Create Connection: This option does not load the data to a worksheet. Instead, it creates a connection that holds the data in memory. This is extremely useful for two main reasons:
- When you have intermediate queries used to merge or append other queries, you don't need to see their output in the workbook.
- When you're loading a very large dataset that you plan to analyze with a PivotTable, loading it as a connection first and then adding it to the Data Model is much more efficient.
- Add this data to the Data Model: This checkbox tells Excel to load the query's output into its internal Data Model. The Data Model is a high-performance data store that can handle millions of rows of data far more efficiently than a worksheet. It's the foundation for creating advanced PivotTables that combine data from multiple tables.
For a freelance expert, the most common and powerful combination for analytics is to select Only Create Connection and check Add this data to the Data Model. This keeps your Excel files lean and fast, even with large amounts of data.
2. Loading Strategies in Action
Theory is one thing, but seeing these options in practice makes them much clearer. Let's watch a video that demonstrates how to use the Load To... feature for different scenarios.
Power Query and the Secrets of the LOAD To Option
This video from Mike Thomas provides clear, practical demonstrations of loading data to a worksheet, to the Data Model, and handling multiple queries at once.
Please watch the following segments: Loading to an existing worksheet: Watch from this demonstration to see how to load data not just to a new sheet, but to a specific cell on a sheet you've already set up. Loading to the Data Model: Next, watch from this section. This clip shows the exact process we just discussed: using "Only Create Connection" in combination with "Add this data to the Data Model". This prevents the data from cluttering a worksheet while making it available for analysis. A practical gotcha: Finally, watch from this example. It highlights how Excel's default behavior can sometimes be surprising (e.g., automatically loading multiple queries to the Data Model) and how to use Load To... to override it and get the result you want.
3. Keeping Your Data Up-to-Date: Managing Refresh Settings
The power of using Power Query is that it creates a repeatable process. When your source data (like a CSV file or web page) changes, you don't need to repeat all the transformation steps manually. You simply need to refresh the query.
You can refresh your data manually in a few ways:
- Right-click on the query output table (or the query in the "Queries & Connections" pane) and select Refresh.
- Go to the Data tab and click Refresh All. This will refresh all queries and other data connections in your workbook.
For more control, you can automate the refresh process using the query's properties.
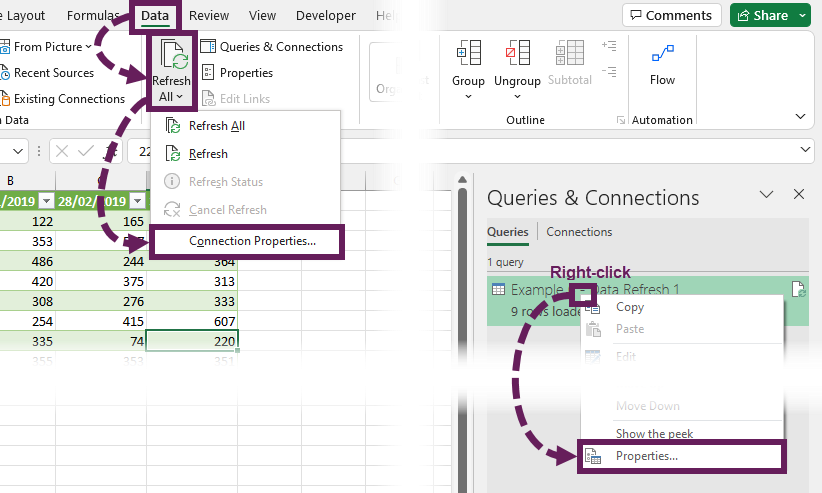
41 - How to Refresh Queries in Excel Power Query
This video from the TrumpExcel channel gives a thorough tour of the refresh options available for a query.
We will focus on the non-VBA methods for now. We will cover VBA automation in a later module. First, watch the segment on manual refreshing from this section. Next, watch the detailed walkthrough of the Query Properties dialog box from this overview. This will explain options like refreshing on a timer, refreshing when the file opens, and the purpose of the background refresh setting.
The most useful automated option for many business reports is Refresh data when opening the file. This ensures that whenever you or a client opens the workbook, the data is guaranteed to be current without any extra steps.
4. Setting Your Preferences: Default and Existing Queries
Finally, you can streamline your workflow by changing Power Query's default load behavior and by modifying the load settings of queries you've already created.
Changing Default Load Settings
If you find yourself always using the same Load To... settings, you can make them the default. For example, you can set Power Query to always create a connection-only query by default, which is a common best practice.
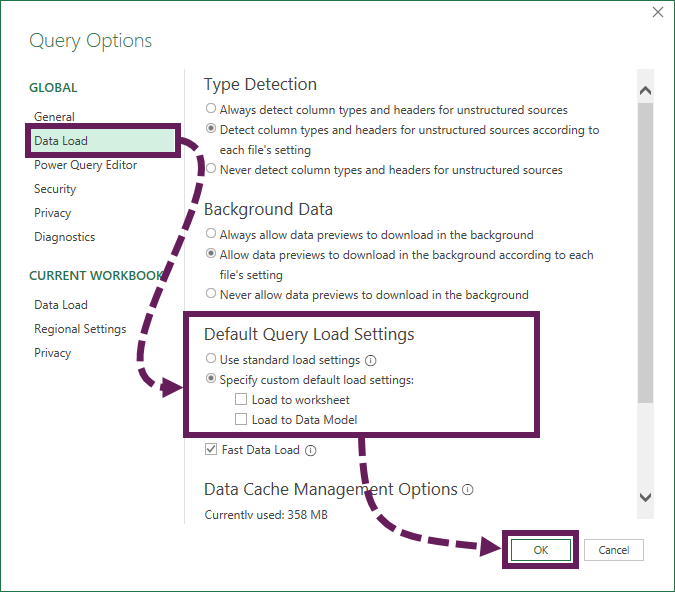
You can access these settings by going to Data > Get Data > Query Options... and navigating to the Data Load section under the GLOBAL heading.
Changing an Existing Query's Load Settings
What if you've already loaded a query as a table but now decide you want it to be a connection-only query loaded to the Data Model? You don't need to delete and re-import it. You can change the load settings directly from the Queries & Connections pane (accessible from the Data tab). Simply right-click the query you want to change and select Load To... This will reopen the familiar Import Data dialog box, allowing you to choose a new destination.
Get to know Power Query Close & Load options
This article also provides a concise guide for these final management tasks.
To finish, please read the last two instructional sections of the article: Read how to change settings for an existing query. This shows you how to use the "Queries & Connections" pane to modify a query's load destination after the fact. Review the section on changing default settings. This reinforces the process for customizing your global load options.
Conclusion
Congratulations on completing the Power Query module! You have now mastered the end-to-end process of automated data transformation in Excel.
Key Takeaways:
Close & Load To...is your command center for deciding how and where your transformed data appears in Excel.- Loading data as a Table is best for smaller datasets that you need to see directly on a worksheet.
- Using Only Create Connection combined with Add to the Data Model is the professional standard for large datasets and for preparing data for complex analysis with PivotTables. It keeps your workbooks fast and efficient.
- Managing Refresh Settings is crucial for keeping your reports and analysis current, with options for both manual and automated updates.
- You can change the load settings for existing queries and set global defaults to match your preferred workflow.
You are now fully equipped to connect to messy data, clean it up with a repeatable process, and load it efficiently into Excel. In our next module, we'll take this clean data and learn how to summarize, analyze, and gain insights from it using one of Excel's most powerful features: PivotTables. The work you've done here preparing data for the Data Model will be the perfect foundation.