Introduction
Welcome to the first lesson of our new module on PivotTables! In our previous module, we mastered Power Query, learning how to connect to, transform, and load data efficiently. You now have the skills to prepare clean, structured datasets—the perfect raw material for analysis. This lesson marks the transition from preparing data to analyzing it.
We will be exploring PivotTables, arguably Excel's most powerful feature for summarizing and analyzing large amounts of data without writing a single formula. For someone starting out, this tool can seem complex, but you'll soon see it's an intuitive and indispensable part of any data professional's toolkit. Today, your goal is to learn how to create a basic PivotTable from a source dataset, which is the foundational skill for all the advanced analysis we'll do later.
1. From Raw Data to Insight: What is a PivotTable?
Imagine you have a spreadsheet with thousands of rows of sales data. Your manager asks, "What were the total sales for each region?" or "How many units of each product did we sell?" You could try to answer this with formulas like SUMIF, but as the questions get more complex, the formulas become unwieldy.
This is precisely the problem PivotTables solve. They allow you to take a large, flat table of data and "pivot" it into a summarized report. You can dynamically rearrange the report by dragging and dropping fields to answer different questions in seconds.
To understand the difference between raw data and a PivotTable summary, let's watch a brief introductory clip.
Excel PivotTables for Beginners (2026)
This clip from Excel University clearly illustrates the distinct roles of a data table (for storing details) and a PivotTable (for creating summaries).
Watch the section from the introduction. Notice how the PivotTable condenses many transactional rows into a compact, aggregated view.
2. Preparing Your Data for Success
Before you create a PivotTable, you must ensure your data is well-structured. This means:
- Your data should be in a tabular format, with each column having a unique header in the first row.
- There should be no blank rows or columns within your dataset.
While you can create a PivotTable from a simple range of cells, it is a strong best practice to first convert your data into an Excel Table. As you may recall from Module 4, an Excel Table provides several advantages. For PivotTables, the most important benefit is that they are dynamic. If you add new rows of data to your source Table, your PivotTable will automatically include them the next time you refresh it.
Let's see how to quickly convert a data range into an Excel Table.
Pivot Table Excel | Step-by-Step Tutorial
This video by Kevin Stratvert demonstrates the recommended first step of turning your raw data into a structured Excel Table.
Watch the segment from preparing the data. The process is as simple as clicking anywhere in your data and using the Insert > Table command.
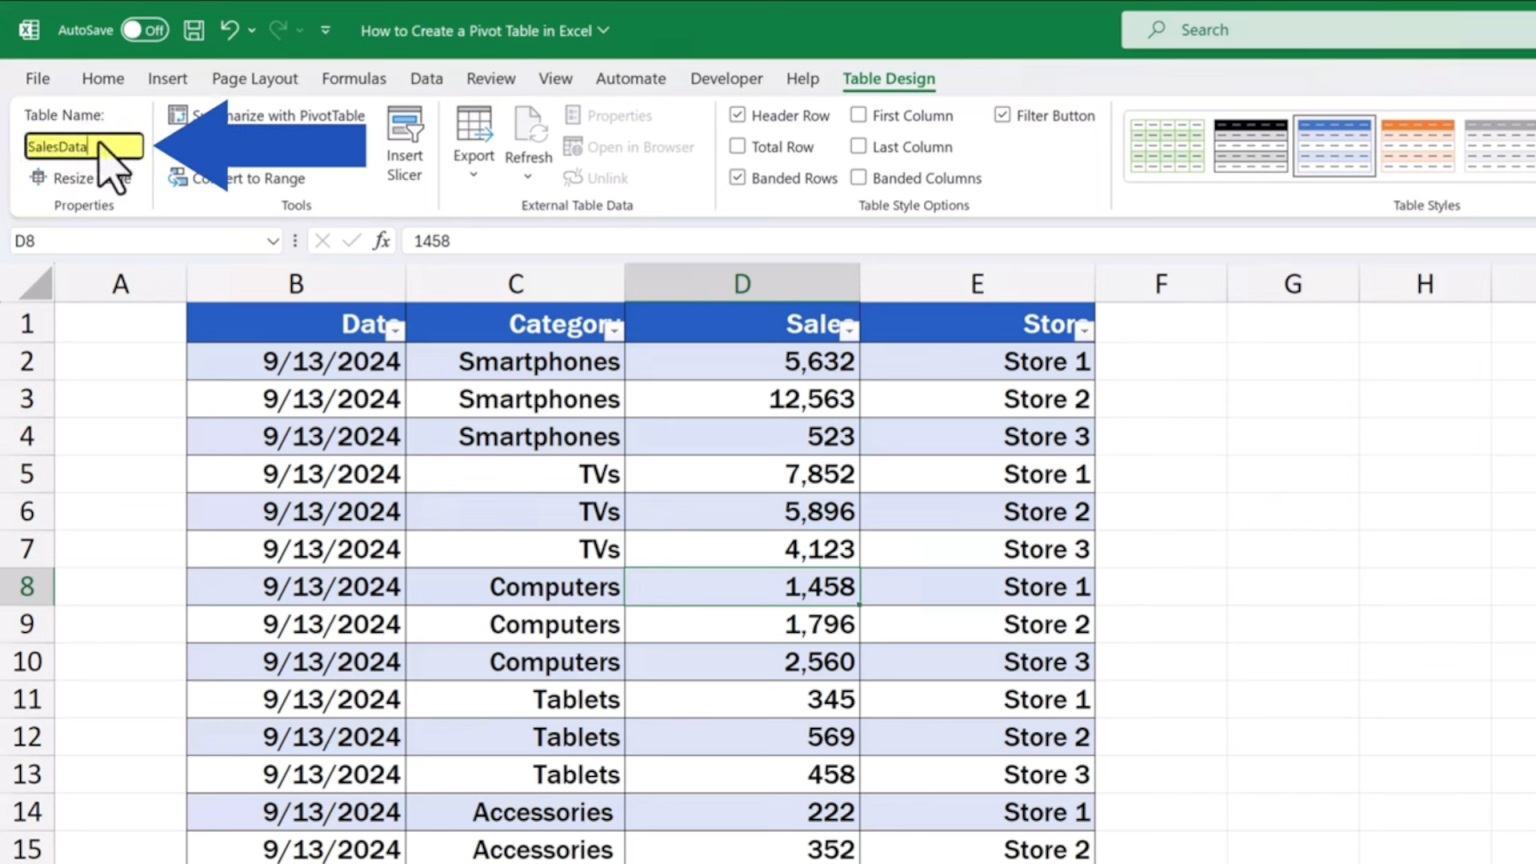
Once you've created a table, it's also good practice to give it a meaningful name. You can do this from the Table Design tab that appears when you select any cell within the table. Naming your table "SalesData" is much clearer than using the default "Table1".
3. Creating Your First PivotTable
With your data prepared in an Excel Table, you are ready to create the PivotTable itself. The process involves just a few clicks.
- Click any single cell inside your Excel Table.
- Go to the Insert tab on the ribbon.
- Click PivotTable.
This will open the "Create PivotTable" dialog box. Because you started from within an Excel Table, Excel automatically populates the Table/Range field with your table's name. You then choose where to place the new PivotTable report: in a new worksheet (most common) or on an existing one.
This next video will walk you through this exact process.
Excel PivotTables for Beginners (2026)
The "Excel PivotTables for Beginners" video provides a clear demonstration of inserting a PivotTable from a table.
Please watch from inserting a PivotTable. This covers selecting the source and choosing the destination for your report.
4. Understanding the PivotTable Interface
After you click OK, Excel creates a new worksheet with a PivotTable placeholder on the left and a PivotTable Fields pane on the right. This pane is your control center for building the report. If you ever click outside the PivotTable area and the pane disappears, simply click back into the placeholder to make it reappear.
Let's break down what you're seeing.
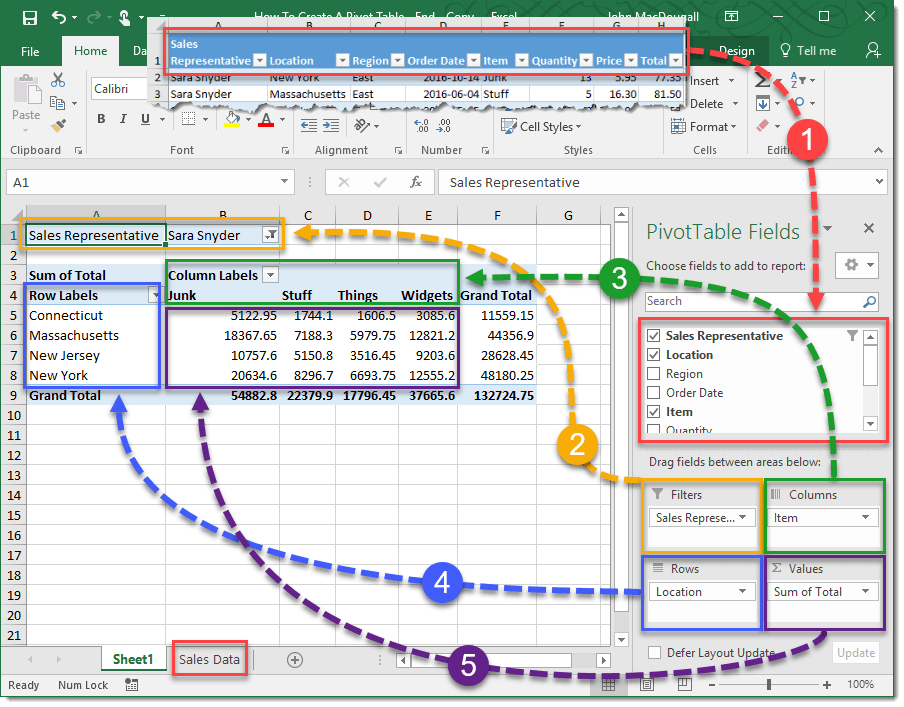
As shown in the image above, the PivotTable Fields pane has two main sections:
- Field List: At the top is a list of all the column headers from your source data. Each of these is a "field" you can use to build your report.
- Layout Areas: At the bottom are four boxes that represent the different parts of your report. You build the report by dragging fields from the list above into these boxes.
- Rows: Fields placed here will become the row labels of your report. Each unique item in the field gets its own row.
- Columns: Fields placed here become the column labels.
- Values: This area is for the fields you want to calculate. It typically holds numeric data that will be summed, averaged, or counted.
- Filters: Fields placed here allow you to apply a high-level filter to your entire report.
For today, we will focus on the two most fundamental areas: Rows and Values.
5. Building a Basic Summary Report
Now it's time to bring your PivotTable to life. Let's say we want to answer the question: "What are the total sales for each salesperson?"
To build this report, you simply:
- Drag the
Salespersonfield from the Field List and drop it into the Rows area. - Drag the
Sales Amountfield and drop it into the Values area.
Instantly, the PivotTable on the left will update. It will list each unique salesperson in a separate row and show the sum of their sales next to them. You've just created a powerful summary report in seconds, with no formulas required.
Let's watch this in action.
Pivot Table Excel | Step-by-Step Tutorial
Kevin Stratvert's video provides an excellent, practical example of building this exact report to answer a business question.
Watch the segment from building the pivot table to see how dragging fields into the Rows and Values areas generates an instant summary.
6. Practice Makes Permanent
The best way to solidify your understanding is to build a PivotTable yourself. The following resource provides a downloadable workbook with practice problems.
Pivot Table Practice Examples in Excel (Free Workbook) - PivotXL
This resource from PivotXL is designed for hands-on practice, which is key to mastering PivotTables. We'll start with the first and most basic example.
First, please download the workbook provided in the article. Open the file and go to the "Transactions" sheet to see the dataset. Next, follow the steps for Example 1 to create your own PivotTable. The steps are: Select the dataset (or convert it to an Excel Table first, as we learned). Insert a PivotTable onto a new worksheet. Drag the Region field to the Rows area. Drag the Amount field to the Values area. Your result should be a simple report showing the total sales amount for each of the four regions. Spend a few minutes exploring the workbook and getting comfortable with this process.
Conclusion
In this lesson, you have taken the first crucial step into the world of PivotTables. You've learned that they are not as intimidating as they might seem and are incredibly powerful tools for turning raw data into meaningful summaries.
Key Takeaways:
- A PivotTable summarizes large datasets, allowing you to "pivot" the data to see different perspectives.
- Always start with clean, tabular data, and it is a best practice to convert your data into an Excel Table before creating a PivotTable.
- You create a PivotTable using the Insert > PivotTable command.
- The PivotTable Fields pane is your control center, where you build reports by dragging fields into the Rows, Columns, Values, and Filters areas.
You now have a solid foundation for creating a basic PivotTable. In our next lesson, we will build upon this by exploring the Values area in more detail. You'll learn how to change the summary calculation from a sum to a count, average, minimum, or maximum, and how to display values as percentages of a total.