Introduction
In our last lesson, you mastered the Unpivot feature, a crucial step for transforming "wide" data into a "tidy," analysis-ready format. Once your data is tidy, with each row representing a single observation, the next logical step is to summarize it. Instead of loading millions of rows of transactional data into Excel, what if you could first calculate the monthly totals or count the transactions per category directly within Power Query? This is precisely what we will cover today.
This lesson introduces the Group By feature, Power Query's equivalent of a PivotTable's summarization engine. You will learn how to take detailed, row-level data and condense it into powerful summary tables. Mastering this skill is fundamental for any data analysis task, as it allows you to efficiently process large datasets and prepare high-level summaries for reports and dashboards—a core activity for any freelance Excel expert.
1. The Concept of Grouping and Aggregation
Before diving into the mechanics, let's clarify the terminology. The process involves two main actions:
- Grouping: This is the act of categorizing your rows based on the values in one or more columns. For example, you might group all sales transactions by the "Country" column.
- Aggregation: This is the calculation you perform on each group. After grouping all sales by country, you could then aggregate them by calculating the total sales (
Sum), the number of sales (Count), or the average sale amount (Average) for each country.
Together, grouping and aggregation allow you to distill vast amounts of data into concise, meaningful insights.
The Group By command is one of the most accessible features in the Power Query editor. You can find it on both the Home tab and the Transform tab of the ribbon.
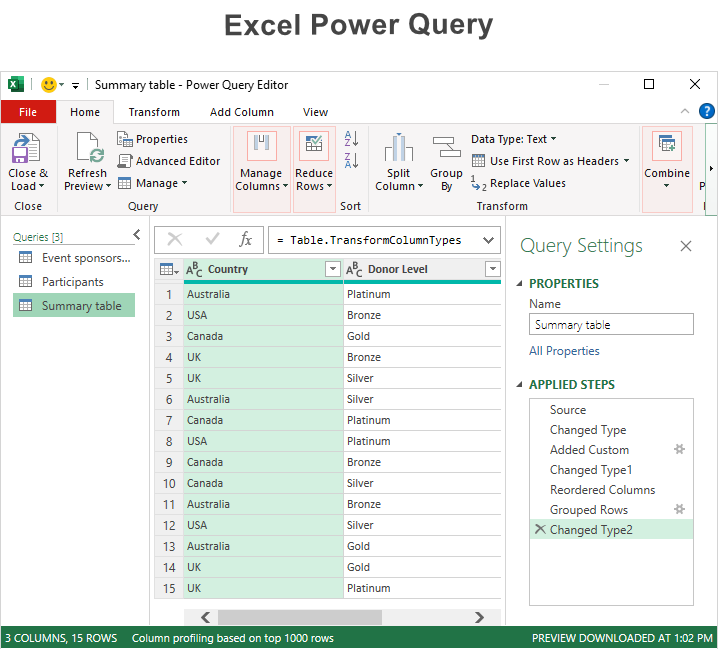
The Group By button is prominently featured on the Home and Transform tabs in the Power Query Editor.
2. Basic and Advanced Grouping
The Group By dialog box offers two modes: Basic and Advanced. Basic mode is for simple summaries where you group by a single column, while Advanced mode lets you group by multiple columns and perform several aggregations simultaneously.
Let's watch a video that demonstrates both modes in action.
Summarizing Data with Group By in Power Query
This video from Excel Off The Grid provides clear, practical examples of how to use the Group By feature for data summarization.
Please watch the following segments: Introduction and Basic Grouping: Watch from the start to the first example. The presenter explains the purpose of Group By and demonstrates a basic grouping to calculate the average sale by product. Advanced Grouping: Continue watching from the second example. Here, the presenter uses the Advanced option to group by two columns (Product and Customer) and create two aggregations: the sum of sales and a count of transactions.
As you saw, the process is quite intuitive. In the advanced example, two new columns were created:
- Total Sales: This used the
Sumoperation on theValuecolumn. - Total Transactions: This used the
Count Rowsoperation.
Notice that Sum requires you to specify a column to calculate, while Count Rows does not. This is because Count Rows is a row operation (it just counts rows in a group), whereas Sum is a column operation (it needs a column of numbers to add up).
The dialog for creating multiple aggregations, like in the video's second example, looks like this:

The Advanced Group By window allows for grouping by multiple columns and creating several aggregated columns at once.
3. Exploring Aggregation Operations
Power Query offers a rich set of aggregation operations beyond just Sum and Count. The official Microsoft documentation provides a helpful table that lists all available operations.
How to GROUP BY or summarize rows - Power Query
This article from Microsoft Learn details the various aggregation functions available in Power Query.
Read the section Operations available. Pay attention to the table that describes each operation, such as Sum, Average, Median, Min, Max, and Count rows. This will give you a complete picture of the calculations you can perform.
Understanding these options allows you to create a wide variety of summaries, from finding the highest sale in a category (Max) to calculating the median transaction value (Median).
4. A Powerful Technique: Using "All Rows"
One of the most powerful—and initially less intuitive—operations is All Rows. Instead of calculating a single value like a sum or average, All Rows returns a nested Table for each group, containing all the original rows belonging to that group.
Why is this useful? It allows you to perform more complex, custom calculations on each group. For instance, you could group sales by country and then, for each country's nested table, find the top-performing product or calculate a specific ratio that isn't available as a standard aggregation.
Let's walk through a practical example from the Microsoft documentation that demonstrates this power. The goal is to create a summary table that not only shows total sales per country but also identifies the single best-selling product within each country.
How to GROUP BY or summarize rows - Power Query
This section provides a step-by-step guide for an advanced grouping scenario using the 'All Rows' operation.
Carefully read and follow the steps in the section titled "Perform an operation...".
The key steps are:
- Group By
CountryandSales Channel, creating one column forTotal units(aSum) and a second column using theAll rowsoperation. This will result in a column containing[Table]objects. - Add a Custom Column using the formula
Table.Max([Products], "Units")to find the row with the highest unit sales within each nested table. This creates a column of[Record]objects. - Expand the new
[Record]column to pull out theProductname andUnitsfor the top performer.
This example is a fantastic illustration of how you can move beyond simple aggregations to perform sophisticated, group-specific analysis directly within Power Query.
5. A Glimpse at Fuzzy Grouping
For an aspiring Excel expert, it's worth knowing about a more advanced feature called Fuzzy Grouping. Sometimes, your data isn't clean. You might have a column with entries like "USA", "U.S.A.", and "United States". A standard Group By would treat these as three separate groups.
Fuzzy Grouping uses an algorithm to group together text values that are similar but not identical. This is an incredibly powerful data cleaning tool. While we won't dive deep into it today, knowing it exists is important for your toolkit. You can read about it in the same Microsoft article when you encounter such a data cleaning challenge.
Conclusion
In this lesson, you've learned how to move from tidy data to summarized insights using Power Query's Group By feature. This is a cornerstone of data preparation, enabling you to handle large datasets with ease and efficiency.
Key Takeaways:
- Grouping and Aggregating are used to summarize detailed data into high-level reports.
- Basic vs. Advanced Grouping: Use
Basicfor single-column groups andAdvancedfor multi-column groups or multiple aggregations. - Aggregation Operations: Power Query provides a wide range of functions, including
Sum,Average,Count Rows,Min,Max, andMedian. - The
All RowsOperation: This is a powerful technique that creates nested tables for each group, enabling complex, custom calculations that go beyond standard aggregations.
So far in this module, you have learned to connect to data, transform it, combine it, reshape it, and now, summarize it. All these actions are performed through a user-friendly interface. But what's happening behind the scenes? In our next lesson, we will pull back the curtain and look at the M language, the code that Power Query generates for every step you take.