Introduction
In our last session, you mastered creating dynamic charts using Excel Tables, a crucial skill for building reports that automatically update as new data is added. We've made our charts "live"; now, it's time to make them interactive. This lesson directly addresses your goal of building professional dashboards by introducing the tools that allow clients and end-users to explore data on their own.
We will focus on Slicers and Timelines, which are essentially user-friendly, visual filters. Instead of relying on clunky drop-down menus, you can provide elegant, clickable buttons that control all the charts and tables on a dashboard simultaneously. By the end of this lesson, you will be able to add these interactive controls to a set of charts, transforming a static report into a dynamic and engaging dashboard experience.
1. What are Slicers and Timelines?
Before we dive into building, let's clarify what these tools are.
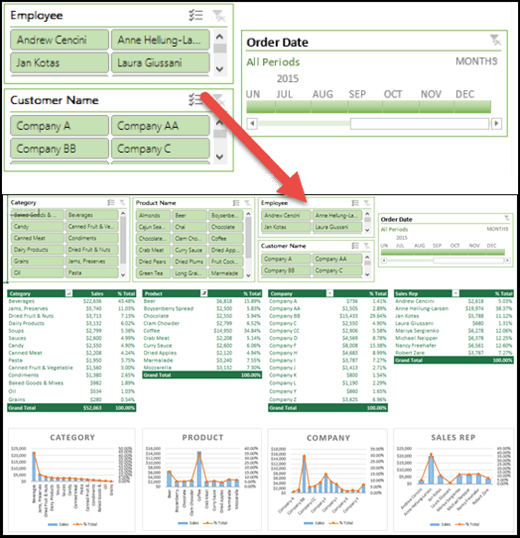
- Slicers are visual filtering components that contain a set of buttons. Each button corresponds to a value in your data field (e.g., "Company A," "Company B" for a Customer Name field). Clicking a button filters your connected PivotTables and PivotCharts to show only the data for that selection.
- Timelines are a special type of slicer designed exclusively for filtering date fields. They provide a scrollable, visual timeline that you can use to filter data by years, quarters, months, or even days.
These tools are what elevate a collection of charts into a true dashboard. They empower the user to ask and answer their own questions by exploring the data from different angles.
2. Adding Slicers and Timelines to a PivotChart
Let's begin with the practical steps. Since your learning style is hands-on, we'll start by adding these controls. For this exercise, you'll need at least one PivotChart. If you don't have one ready, quickly create one from a simple dataset containing columns like Date, Product, and Sales.
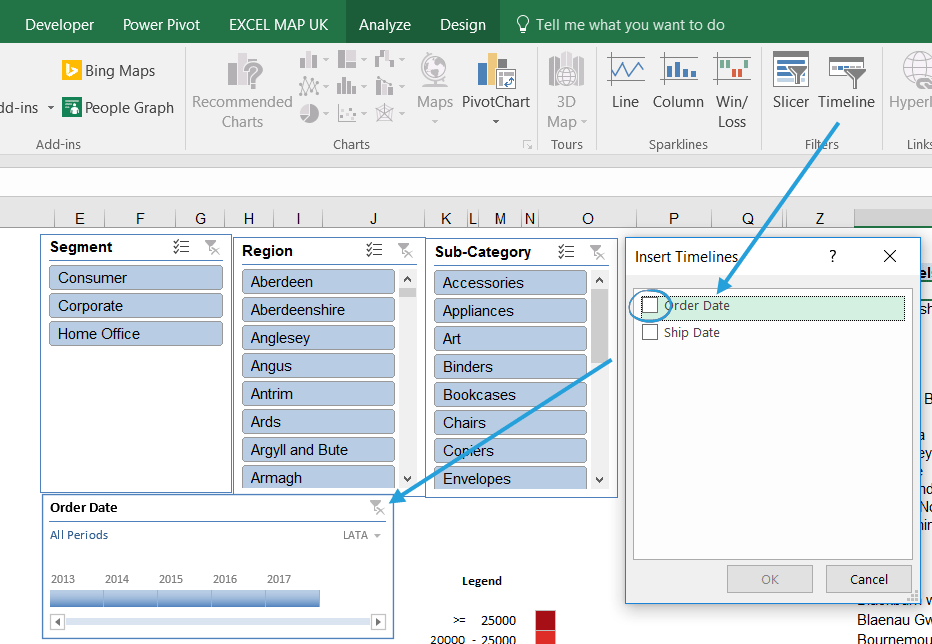
The process begins by selecting a PivotTable or PivotChart you want to filter.
Interactive dashboards in Excel with slicers & timelines
The video "Interactive dashboards in Excel with slicers & timelines" provides a quick and clear demonstration of creating your first Slicer and Timeline.
First, watch how to add a slicer by right-clicking a field in the PivotTable Fields list or by using the ribbon. Next, see how a timeline is added for a date field, and how you can switch between time periods like years, quarters, and months.
After following these steps, you will have a Slicer and a Timeline on your worksheet. If you click a button on your new Slicer, you'll notice it filters the PivotChart you used to create it. However, if you have other charts on your dashboard, they remain unchanged. This is the central challenge we need to solve to create a truly unified dashboard.
3. The Key to Interactivity: Report Connections
A dashboard is only truly interactive if a single action by the user updates all relevant components at once. By default, a Slicer or Timeline is only connected to the single PivotTable it was created from. The key to making everything work together is the Report Connections feature. This allows you to link a single Slicer to multiple PivotTables.
The following video provides an excellent, concise walkthrough of this essential step.
📊 How to Build Excel Interactive Dashboards
In the video "How to Build Excel Interactive Dashboards," Kevin Stratvert clearly demonstrates how to connect your interactive controls to all the elements of your dashboard.
Watch the section from connecting slicers. Pay close attention to how he right-clicks the slicer and uses the "Report Connections" dialog box to check the boxes for all the other PivotTables he wants the slicer to control. You must repeat this for every Slicer and Timeline you add.
To reinforce this crucial concept, the Microsoft Support documentation also provides a step-by-step guide.
Create and share a Dashboard with Excel and Microsoft ...
This official guide provides a reliable text-based reference for the steps involved in connecting your slicers.
Focus on step 3 under the "Add Slicers and a Timeline" heading. Read the short paragraph on Slicer Connections. This confirms that you must select each Slicer and manually configure its connections via the Slicer tab > Report Connections.
Pro Tip: When you open the Report Connections dialog, you'll see a list of PivotTables like PivotTable1, PivotTable2, etc. This can be confusing. For a more professional workflow, it's best practice to give your PivotTables meaningful names. You can do this by selecting a PivotTable, going to the PivotTable Analyze tab, and typing a new name in the PivotTable Name box on the far left. This makes managing connections much easier, especially in complex dashboards.
4. Customizing Slicers for a Polished Look
Functionality is key, but for a professional deliverable, appearance matters. Default Slicers can be large and may not match your dashboard's color scheme. Fortunately, Excel gives you full control over their design.
Excel Slicer: A Step-by-Step Guide to Advanced Filtering
This DataCamp article provides an excellent overview of how to format and customize your slicers to fit your dashboard's design and improve usability.
Please read the section titled How to Customize Appearance. This guide covers several important adjustments: Changing the style: Apply built-in color themes or create your own. Adjusting settings: Hide the header if the title is redundant. Optimizing layout: Change the number of columns to turn a long, single-column slicer into a compact, multi-column grid of buttons. This is one of the most useful customizations for saving space on a dashboard.
By arranging your formatted Slicers neatly, typically at the top or left side of your dashboard, you create an intuitive control panel for your client.
Conclusion
In this lesson, you've moved beyond static visualizations and learned how to give your dashboards an interactive front-end. By adding Slicers and Timelines, and critically, by using Report Connections to link them to all your PivotCharts, you can build a cohesive and user-friendly analytical tool. This is a significant step in your journey to becoming an Excel expert capable of delivering high-value freelance projects.
Key Takeaways:
- Slicers and Timelines are visual filters that make dashboards interactive and easy to use.
- They are added from the PivotTable Analyze or PivotChart Analyze tab.
- The Report Connections feature is essential for linking a single Slicer to multiple PivotTables, ensuring the entire dashboard updates in unison.
- Customizing the style, columns, and size of Slicers is crucial for creating a polished and professional-looking dashboard.
In our next lesson, we will explore another method for adding interactivity: form controls. While Slicers are perfect for filtering based on existing data categories, form controls like drop-down lists can be used to create even more dynamic scenarios, such as allowing a user to select which metric a chart displays.