Welcome to the fourth lesson in our initial module. In our last session, we mapped out the end-to-end Machine Learning Development Lifecycle, from business problem framing through to model monitoring. You'll recall that a crucial stage in this cycle is model validation, where a model's performance is rigorously assessed before it can be considered for deployment.
Today, we will delve into that validation step. This lesson is designed to help you interpret the key evaluation metrics that data science teams use to measure a model's performance. We'll focus on accuracy, precision, recall, and the F1 score. As a solution architect, your goal isn't to calculate these metrics yourself, but to understand what they mean, why a single metric like "accuracy" can be dangerously misleading, and how to translate these numbers into tangible business implications and risks. This knowledge is essential for asking the right questions and making informed architectural decisions.
Why "99% Accurate" Can Be a Red Flag
Imagine your team builds a model to detect fraudulent transactions. They report it's "99% accurate." This sounds fantastic, but what if only 1% of all transactions are actually fraudulent? A lazy model that simply classifies every transaction as "not fraudulent" would also achieve 99% accuracy, while being completely useless at its core task.
This highlights the "accuracy trap," especially with imbalanced datasets where one outcome is much rarer than the other. To get a true picture of performance, we need to break down the model's predictions in more detail. The fundamental tool for this is the confusion matrix.
A confusion matrix is a simple table that shows where a model gets things right and where it gets "confused." It provides the raw data needed to calculate more nuanced metrics. The following video provides an excellent walkthrough of what a confusion matrix is, why it's necessary, and how to interpret it.
The Confusion Matrix in Machine Learning
Watch the video "The Confusion Matrix in Machine Learning" from the Underfitted channel.
Pay close attention to these segments: The introduction explaining why a single metric is not enough. The explanation of the matrix layout, distinguishing between expected vs. predicted values. The walk-through of how the matrix is filled with results. The definition of the four key outcomes: True Positives, False Negatives, False Positives, and True Negatives.
As the video explains, for any classification problem, there are four possible outcomes for a prediction:
- True Positive (TP): The model correctly predicts the positive class. (e.g., correctly identifies a fraudulent transaction).
- True Negative (TN): The model correctly predicts the negative class. (e.g., correctly identifies a legitimate transaction).
- False Positive (FP): The model incorrectly predicts the positive class. (e.g., flags a legitimate transaction as fraudulent). This is also known as a "Type I error."
- False Negative (FN): The model incorrectly predicts the negative class. (e.g., misses a fraudulent transaction, labeling it as legitimate). This is also known as a "Type II error."
These four numbers are the building blocks for the most important evaluation metrics.
The Trade-Off: Precision vs. Recall
With the confusion matrix as our foundation, we can now define two critical, often competing, metrics: precision and recall. Rarely can you maximize both at the same time; understanding their trade-off is central to aligning a model with business objectives.
The article "Precision, Recall and F1 Explained (In Plain English)" gives a clear, non-technical overview.
Precision, Recall and F1 Explained (In Plain English) | DataGroomr
This article from DataGroomr provides a great, straightforward explanation of these core concepts.
Please read the following sections: Start with the section defining the metrics, which introduces the four outcomes and the limitation of accuracy. Then, jump to the section on practical applications. This part is crucial as it connects the metrics to real-world business decisions and trade-offs.
Let's formalize these concepts.
Precision: The Quality of Predictions
Precision answers the question: "Of all the times the model predicted 'positive', how often was it correct?"
- Business Implication: High precision is critical when the cost of a False Positive is high.
- Example: In email marketing, you want to predict which customers are likely to buy a product. A False Positive means sending a promotional email to someone who isn't interested. This is low-cost. However, in banking, a False Positive in a fraud detection system means blocking a legitimate customer's card. This causes significant customer frustration and has a high business cost. In this case, you would demand high precision.
Recall: The Completeness of Predictions
Recall answers the question: "Of all the actual positive cases that exist, how many did the model find?"
- Business Implication: High recall is critical when the cost of a False Negative is high.
- Example: In cancer detection, a False Negative means the model misses a malignant tumor, and the patient goes untreated. The cost is catastrophic. In this scenario, you would prioritize recall, even if it means having more False Positives (i.e., flagging benign tumors for further review by a human expert). You want to catch every possible case.
As an architect, when a data science team presents a model, a key question to ask is: "What is more costly for our business: a False Positive or a False Negative?" The answer determines whether the team should optimize for precision or recall.
The Balancing Act: The F1 Score
So, what do you do when both False Positives and False Negatives are costly? You need a metric that balances precision and recall. This is where the F1 Score comes in.
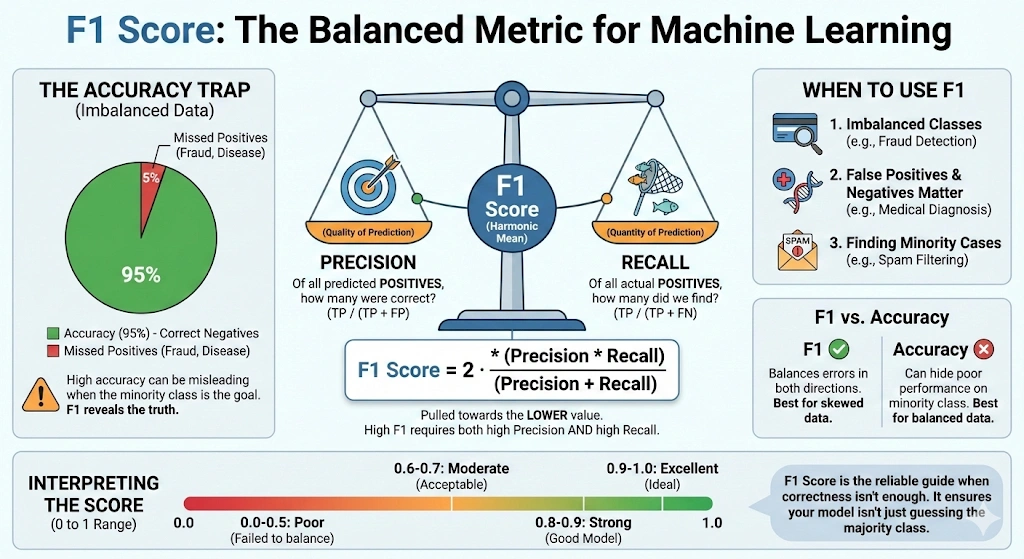
The F1 score is the harmonic mean of precision and recall. It gives a single score that summarizes performance, but unlike accuracy, it is designed to work well on imbalanced datasets.
A high F1 score requires both high precision and high recall. If either one is very low, the F1 score will also be low. It's a more trustworthy measure of a model's effectiveness when you care about finding positive cases without incorrectly flagging too many negative ones.
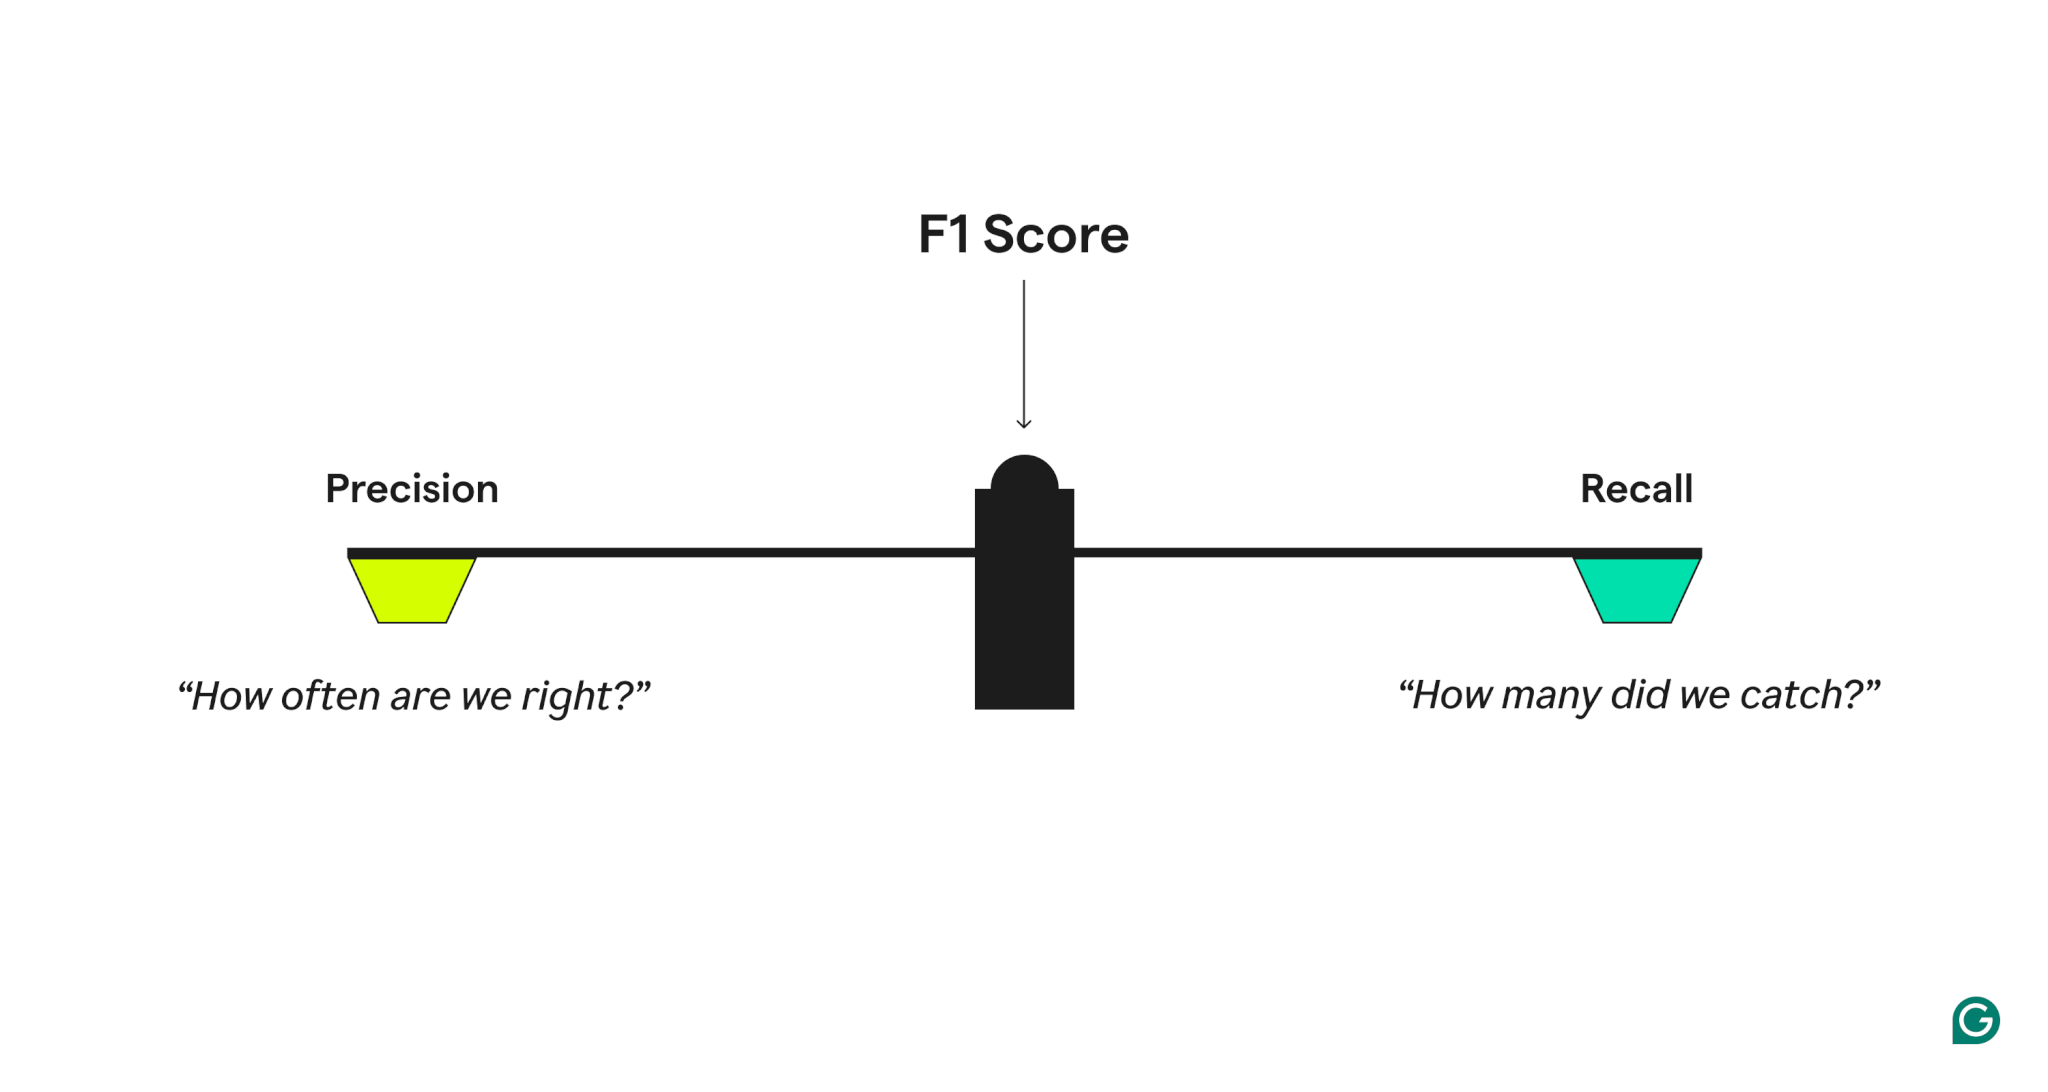
This infographic provides a fantastic summary of everything we've discussed so far, putting all the concepts together.
A Broader View of Evaluation
While we've focused on classification, it's useful to be aware of the metrics used for other ML tasks. The following video gives a concise overview of the metrics we've covered and also introduces metrics for regression tasks (where the model predicts a continuous number, like a house price).
How to evaluate ML models | Evaluation metrics for machine learning
Watch the video "How to evaluate ML models" from AssemblyAI.
Focus on these two parts: A review of classification metrics, including accuracy, precision, recall, and the F1 score. A brief introduction to regression metrics, such as Mean Absolute Error (MAE) and R-squared. This is for your awareness of how different model types are evaluated.
To round out your architectural vocabulary, here are two more terms you might encounter from data science teams, explained in the excellent article "AI/ML Metrics for Managers."
AI/ML Metrics for Managers - How to evaluate ...
This article is written for a leadership audience and frames the metrics in terms of business outcomes.
Review the definitions of Accuracy, Precision, Recall, and F1 Score for a quick summary. Then, read the short explanation of ROC-AUC.
- ROC-AUC: The Receiver Operating Characteristic - Area Under the Curve is another common metric for classification. In essence, it measures the model's ability to distinguish between the positive and negative classes. An AUC of 1.0 is a perfect model, while an AUC of 0.5 is no better than random guessing. It gives a single-number summary of the model's discriminative power across all decision thresholds.
Conclusion
In this lesson, we've unpacked the crucial topic of model evaluation. You now have the conceptual tools to look beyond simple accuracy and engage in meaningful conversations with technical teams about model performance and its direct connection to business value.
Key Takeaways:
- Simple accuracy is often a misleading metric, especially with imbalanced data where one class is rare.
- The confusion matrix (TP, TN, FP, FN) is the foundation for understanding a model's detailed performance.
- Precision measures the quality of positive predictions. It is key when the cost of a False Positive is high.
- Recall measures the completeness of predictions. It is key when the cost of a False Negative is high.
- There is an inherent trade-off between precision and recall that maps directly to business priorities.
- The F1 Score provides a balanced measure of precision and recall, making it a robust metric for many real-world scenarios.
In our next lesson, we will build upon the foundations we've established. Now that you understand the different learning paradigms, the ML lifecycle, and how models are evaluated, we will clarify the distinct architectural responsibilities of a solution architect versus a data scientist in an AI project. This will help you define your specific role in driving these initiatives forward.