Hello! Let's dive into our next lesson.
In our last session, we learned how to install, update, and remove software using package managers like apt and yum. This skill is the gateway to configuring any server. Now that we can add tools to our system, we'll learn how to use them to observe what's happening under the hood.
Today's learning outcome is to monitor system resources including CPU, memory, and disk usage. For a DevOps engineer, this is a daily activity. You need to know if a server is healthy, why an application is slow, or when you need to add more disk space. This lesson will equip you with the fundamental commands to answer these questions.
We'll break this down into three parts:
- Monitoring CPU and Memory
- Monitoring Disk Usage
- A quick look at other essential monitoring tools
1. Monitoring CPU and Memory Usage
When an application is slow or unresponsive, the first suspects are often the CPU and memory. Let's explore the tools to investigate them.
The All-in-One Dashboard: top
The top command is your go-to, real-time system monitor. It comes pre-installed on virtually every Linux distribution, so you can always rely on it. It provides a dynamic view of your system's performance.
When you run top, it can look a bit dense, so we'll break it down.
Demystifying the top Command in Linux | Linux Crash Course Series
The video 'Demystifying the top Command in Linux' from Learn Linux TV provides an excellent walkthrough. We'll watch a few key segments to understand its output.
Please watch the following sections: Introduction to the Interface (02:12 - 03:48): This explains that top is split into two main sections: system statistics at the top and a process list below. CPU Statistics (10:36 - 13:25): Focus on understanding the %Cpu(s) line. Key values are: us: user space (time spent running your applications). sy: system/kernel space (time spent on OS tasks). id: idle time (how much CPU is free). wa: I/O wait (time CPU is waiting for disk or network). Memory and Swap (15:03 - 16:47): This covers the KiB Mem (physical memory/RAM) and KiB Swap (virtual memory on disk) lines, showing total, free, and used amounts. The Process List (16:47 - 18:03): This explains the columns for the running processes, including PID (Process ID), USER, %CPU, and %MEM.
After watching, you should understand that top gives you a live look at resource consumption. A high us or sy value, combined with a low id value, indicates a busy CPU. If your swap usage is high, it often means you're running out of physical RAM.
Interacting with top
The real power of top comes from its interactive commands. While top is running:
- Press
qto quit. - Press
Shift+P(capital 'P') to sort processes by CPU usage. This immediately brings the heaviest CPU consumers to the top. - Press
Shift+M(capital 'M') to sort processes by memory usage. This is invaluable for finding memory leaks.
This interactivity is demonstrated well in the same video from 18:03 to 19:01.
A Quick Memory Check: free
While top shows everything, sometimes you just want a quick, static snapshot of memory usage. The free command is perfect for this. For a more readable output, use the -h (human-readable) flag.
free -h
The output will look something like this:
              total        used        free      shared  buff/cache   available
Mem:          3.8Gi       1.0Gi       1.6Gi       1.0Mi       1.2Gi       2.5Gi
Swap:         2.0Gi          0B       2.0Gi
Here's what the important columns mean:
- total: Total installed memory.
- used: Memory currently in use.
- free: Memory that is completely unused.
- buff/cache: Memory used by the Linux kernel for caching and buffers to speed up disk operations. This memory can be freed up if applications need it.
- available: This is the most important number. It's an estimate of how much memory is available for starting new applications, without starting to swap. It accounts for the memory in
buff/cachethat can be easily reclaimed.
An Enhanced Alternative: htop
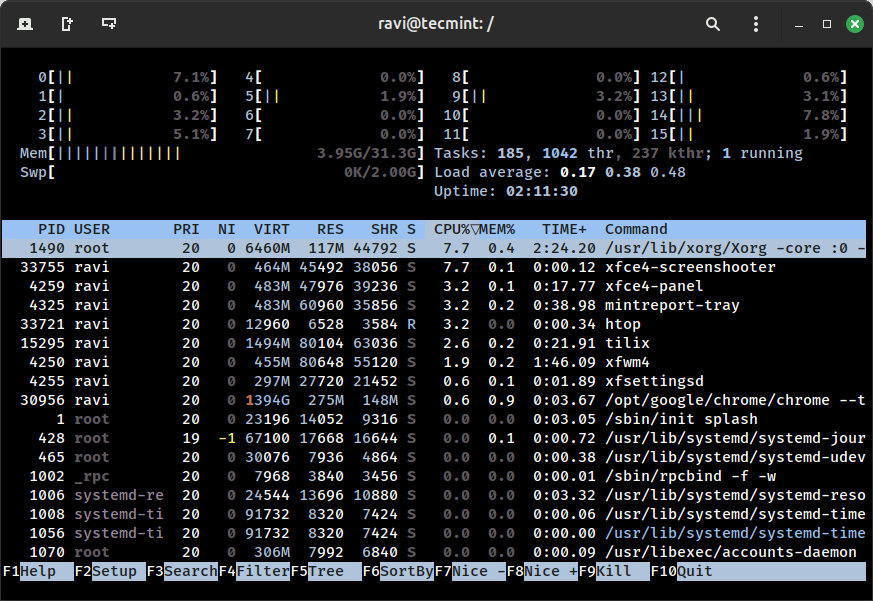
htop is a popular, modern alternative to top. It presents the same information but in a more visual and user-friendly way, with color-coding, clear per-CPU usage bars, and easier navigation.
Since it's not always installed by default, you can install it using the package management skills from our last lesson:
- On Ubuntu/Debian:
sudo apt install htop - On CentOS/RHEL:
sudo yum install htop
2. Monitoring Disk Usage
Running out of disk space can bring a server to a grinding halt. It's critical to know how to check disk space and find out what's consuming it. For this, we use two main commands: df and du.
df(disk free): Reports filesystem (disk/partition) space usage.du(disk usage): Reports file and directory space usage.
A simple way to remember the difference: use df to see if a disk is full, and du to find out what is filling it.
Let's watch a video that explains both commands clearly.
Linux df and du Commands | How to Check Linux Disk Space Usage
The video 'Linux df and du Commands' by Akamai Developer is a perfect guide for this topic. It covers the purpose and practical use of both commands.
Please watch these sections: Using df (00:55 - 02:40): This demonstrates the df -h command to get a human-readable summary of all mounted filesystems. Pay attention to the Use% and Mounted on columns. Introducing du (08:54 - 10:43): This explains why du is needed—to see usage at a folder level—and shows that its default output can be overwhelming. Making du useful (10:43 - 12:58): This is the most important part for du. It shows how to use flags like -h (human-readable) and --max-depth=1 to get a manageable summary of directory sizes. A Powerful du combination (14:52 - 16:49): This demonstrates a very common and powerful pattern: du -sh *. This gives you a summary (-s) in human-readable format (-h) for every file and directory (*) in the current location.
Practical Scenario
Imagine df -h shows that your root filesystem (/) is 95% full. A common culprit is log files piling up in /var/log. To investigate, you would run:
# First, check the size of each directory inside /var
sudo du -h --max-depth=1 /var
This might show that /var/log is consuming many gigabytes. You can then drill down further:
# Now, check the size of each directory and log file inside /var/log
sudo du -h --max-depth=1 /var/log
This process allows you to quickly pinpoint exactly which files are taking up all the space.
Test your understanding!
You've run df -h and see that the /home filesystem is nearly full. What is a single command you could run from the /home directory to see the size of each user's home folder within it?
Show answer
After navigating to /home with cd /home, you could run the following command:
sudo du -sh *
sudois needed to ensure you can read all directories.du calculates disk usage.-sprovides a summary for each argument.-hmakes the output human-readable (e.g.,15Ginstead of a huge number of blocks).*is a wildcard that expands to every file and directory in the current location (/home).
3. A Cheat Sheet of Monitoring Tools
We've covered the essentials, but the Linux world is full of powerful tools. You don't need to master them all now, but it's good to be aware of them.

Conclusion
You now have a solid toolkit for monitoring the three most critical system resources: CPU, memory, and disk. Knowing how to use these commands is not just about troubleshooting; it's about proactive system management, which is at the heart of DevOps.
Key Takeaways:
topis your real-time dashboard for CPU and memory usage. UseShift+PandShift+Mto sort by CPU and memory, respectively.htopis a more user-friendly, visual alternative totop.free -hgives a quick, human-readable snapshot of memory, where theavailablecolumn is the most practical metric.df -hshows you how much space is used on your disks (filesystems).du -hhelps you find which specific files and directories are consuming disk space. Use it with--max-depth=1or-sto get useful summaries.
In our next lesson, we will explore using systemctl to manage the state of systemd services. When your monitoring reveals that a critical service has crashed or is stuck, systemctl is the tool you'll use to restart it and get your system back to a healthy state.