Hello! Welcome to the second lesson in our module on cartography.
In our previous lesson, we established a crucial foundation: understanding map scale. You learned how cartographers shrink the world onto a page and how you can use the scale to calculate real-world distances, both in straight lines and along curved paths.
Now that we can appreciate the size and scope of a map, our next step is to learn its language. Maps communicate vast amounts of information not just through scale, but through a standardized system of symbols and colors.
Today, our learning outcome is to interpret standard map symbols, colors, and legend elements to extract information. By the end of this lesson, you will be able to look at a detailed map and decode its visual language to understand the features of the landscape, both natural and man-made.
1. The Map Legend: Your Key to Interpretation
Before you can read a map, you need to find its dictionary. This is the map legend (or key). It is the single most important piece of marginal information for understanding the map's content. The legend decodes every symbol, color, and line style used by the cartographer.
A common mistake for beginners is assuming that all maps use the same symbols. While there are conventions, symbols can vary between countries, publishers, and even different editions of maps from the same source.
To understand the central role of the legend, we'll consult a section from a US Army manual on map reading. Its emphasis on precision highlights why the legend is non-negotiable.
Please read the section titled 'Marginal Information' and the subsection 'The map legend'. Focus on why the manual stresses that symbols are not universal and why you must always check the legend first.
2. The Language of Color
The first thing you'll often notice about a topographic map is its use of color. Colors provide a quick and intuitive way to identify broad categories of features at a glance. While you should always confirm with the legend, most topographic maps follow a standard color code.
The resource below gives a general overview of these conventions.
Topographic Map Symbols - USGS Publications Warehouse
The U.S. Geological Survey (USGS), a primary producer of topographic maps, provides an excellent summary of how colors and symbols are used. Let's read their introduction.
Please read the section titled 'Reading Topographic Maps.' Pay close attention to the paragraph that begins 'The colors of the lines usually indicate similar classes of information...'. This will outline the standard color conventions.
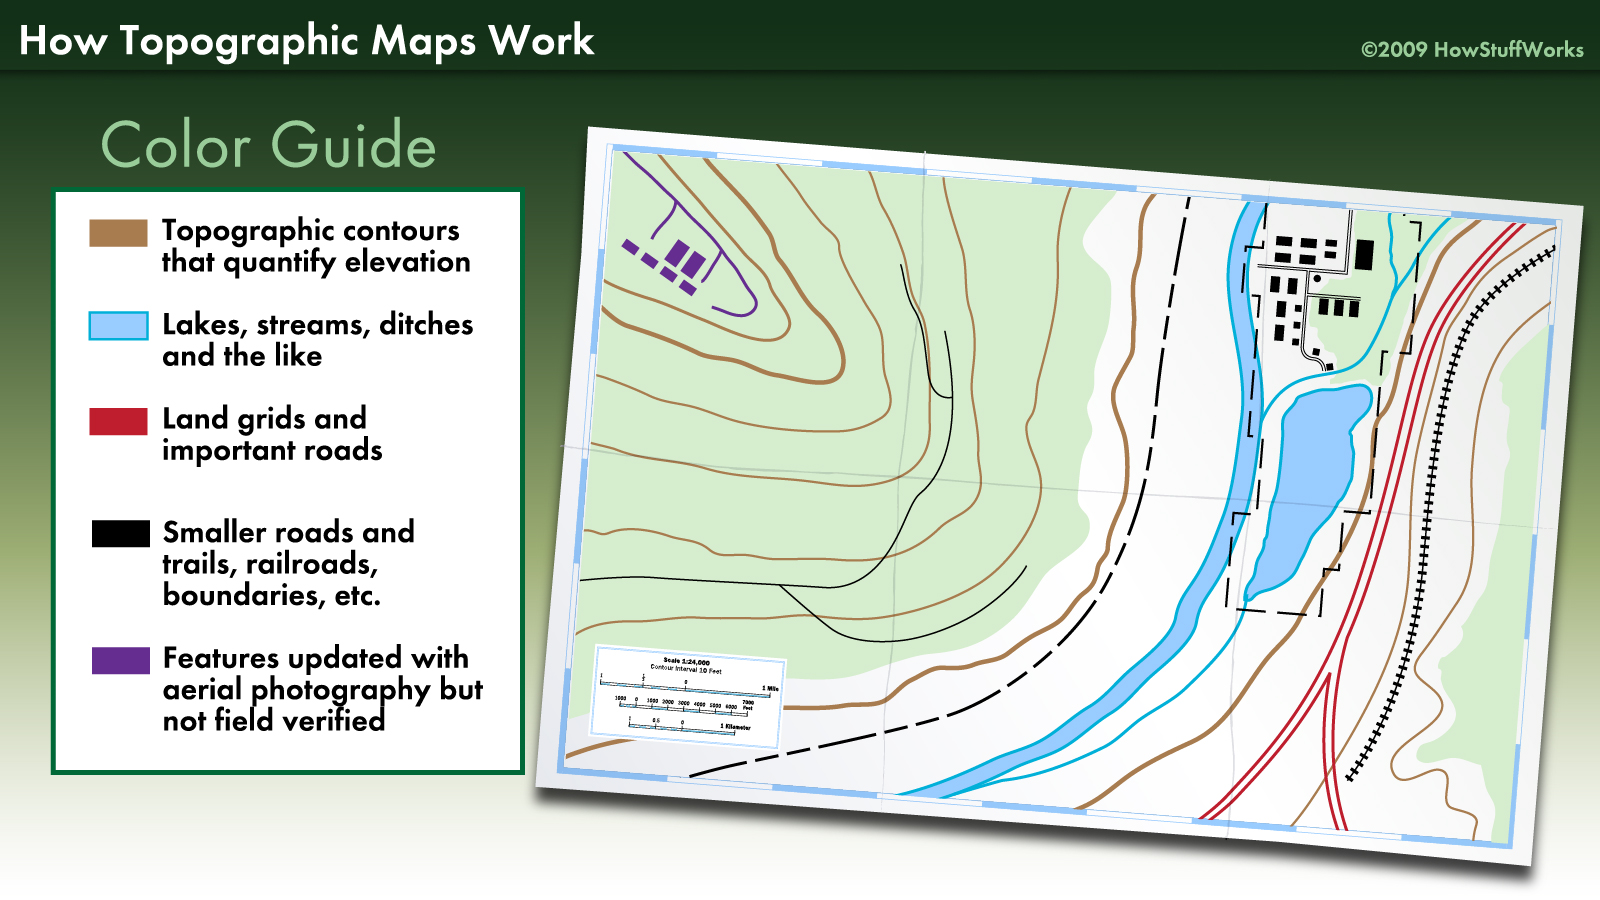
Based on your reading, here are the most common color associations:
- Blue: Represents water (hydrographic) features, such as rivers, lakes, swamps, and oceans.
- Green: Represents vegetation, like forests, woodlands, or orchards. The shade of green can sometimes indicate the density of the vegetation.
- Brown: Used for contour lines, which depict the shape and elevation of the terrain. We will study these in detail in our next lesson.
- Black: Indicates cultural or man-made features, such as buildings, smaller roads, trails, railroads, and boundaries.
- Red: Often used for major, primary roads and highways, as well as important boundaries like those for public lands.
- Purple: On older maps, this was used to show revisions and updates made since the map was first published.
This image provides a perfect visual summary of these color codes in action.
3. Point, Line, and Area Symbols
Beyond broad color fills, maps use specific symbols to represent features. These symbols can be categorized into three types:
- Point Symbols: Used to mark the location of a specific object that is too small to be drawn as an area, such as a school, church, well, or campsite.
- Line Symbols: Represent linear features. The style of the line (solid, dashed, dotted, thick, thin) indicates the type of feature. Examples include roads, trails, railroads, power lines, and streams.
- Area Symbols: Use patterns or color tints (polygons) to show the extent of a feature, like a forest (green tint), a lake (blue tint), a swamp (a specific pattern), or a densely built-up area (red tint).
This next image provides a wonderful illustration of how abstract symbols connect to real-world features.

To give you a sense of the vast vocabulary of map symbols, you should browse this official symbol sheet from the USGS. You do not need to memorize it; the goal is to appreciate the variety and logic of the symbols.
Topographic Map Symbols - USGS Publications Warehouse
This document is the master legend for USGS topographic maps. It's a comprehensive 'dictionary' of map symbols.
Quickly scan through the different categories in this symbol sheet, such as 'Roads and Related Features,' 'Buildings,' and 'Rivers, Lakes, and Canals.' Don't try to learn every symbol. Instead, get a feel for how different features within a category (e.g., different types of roads) are distinguished from one another.
Test your understanding!
Imagine you are looking at a standard topographic map and you see a solid blue line. What does it most likely represent? What if it were a dashed blue line?
Show answer
A solid blue line typically represents a perennial stream or river—one that flows year-round. A dashed (or intermittent) blue line usually represents an intermittent stream—one that only flows during certain times of the year, like after heavy rain or during a wet season. This shows how a simple change in the line style carries important information.
4. A Bridge to the Next Lesson: Symbols for Terrain
So far, we've seen symbols for water, vegetation, and man-made objects. But how does a flat map represent the three-dimensional shape of the land itself? As we've noted, this is done with contour lines.
While we will dedicate our entire next lesson to interpreting contours, it's important to see them now for what they are: a special type of line symbol. Specific patterns of these brown lines create recognizable symbols for major landforms.
This video provides an excellent introduction to the primary terrain features and how they are symbolized on a map using contour lines.
Basic Map Reading: Identify Terrain Features
The following video, from The Gray Bearded Green Beret, demonstrates how to identify major and minor terrain features on a map. For now, focus on simply recognizing the shape of the symbol for each feature.
Watch from 00:35 to 08:20. As you watch, notice how each feature is depicted. For example, a 'hill' is symbolized by concentric circles of contour lines, and a 'valley' is shown by V-shaped contours. Don't worry about the details of elevation or slope yet; just focus on identifying the visual pattern for each feature.
This video gives you a fantastic preview of how powerful map symbols can be. You saw that a pattern of closed circles represents a hill, U- or V-shaped lines pointing downhill represent a ridge, and U- or V-shaped lines pointing uphill represent a draw or valley. These are the fundamental building blocks of reading terrain on a map.
Conclusion
In this lesson, you've learned the "language" of maps. You are now equipped to go beyond simply seeing lines and colors, and can instead extract meaningful information about the world the map represents.
Key Takeaways:
- The map legend is the essential dictionary for decoding any map; always consult it first.
- Colors provide a quick-glance understanding of features: blue for water, green for vegetation, brown for terrain contours, and black/red for man-made structures.
- Features are represented by point symbols (specific locations), line symbols (linear features), and area symbols (features covering a region).
- Even complex three-dimensional landforms like hills and valleys are represented by specific patterns of line symbols called contour lines.
Preview of the Next Lesson:
We've just had a glimpse of how contour lines are used to symbolize terrain. In our next lesson, we will build directly on this introduction. You will learn to read and interpret contour lines on topographic maps to understand elevation and landforms. We will move from simply identifying the symbol for a hill to being able to determine its height, steepness, and precise shape, fully unlocking the three-dimensional power of a topographic map.