Hello! Let's dive into the fourth lesson of our cartography module.
In our last session, we learned to decode the "language" of maps by interpreting symbols and colors. We ended with a preview of a special kind of symbol: contour lines, which represent the three-dimensional shape of the terrain. You learned to recognize the basic visual patterns for features like hills and valleys.
Today, we will build directly on that foundation. Our goal is to read and interpret contour lines on topographic maps to understand elevation and landforms. By the end of this lesson, you won't just see patterns; you'll be able to visualize the landscape in three dimensions, determining the height of mountains, the steepness of slopes, and the direction of river valleys, all from a flat piece of paper. This is one of the most fundamental skills in physical geography and mapping.
1. From a 3D World to 2D Lines
The central challenge of a topographic map is to show a three-dimensional landscape on a two-dimensional surface. It does this using contour lines. A contour line is an imaginary line that connects points of equal elevation above a reference point, usually mean sea level.
Think of it like this: imagine a mountain partially submerged in water. The shoreline would trace a perfect contour line. If the water level rose by 10 meters, the new shoreline would be a new contour line, 10 meters higher than the first. A topographic map is essentially a top-down view of all these shorelines projected onto a flat surface.
This image provides an excellent visual bridge between the real-world landform and its representation on a map.
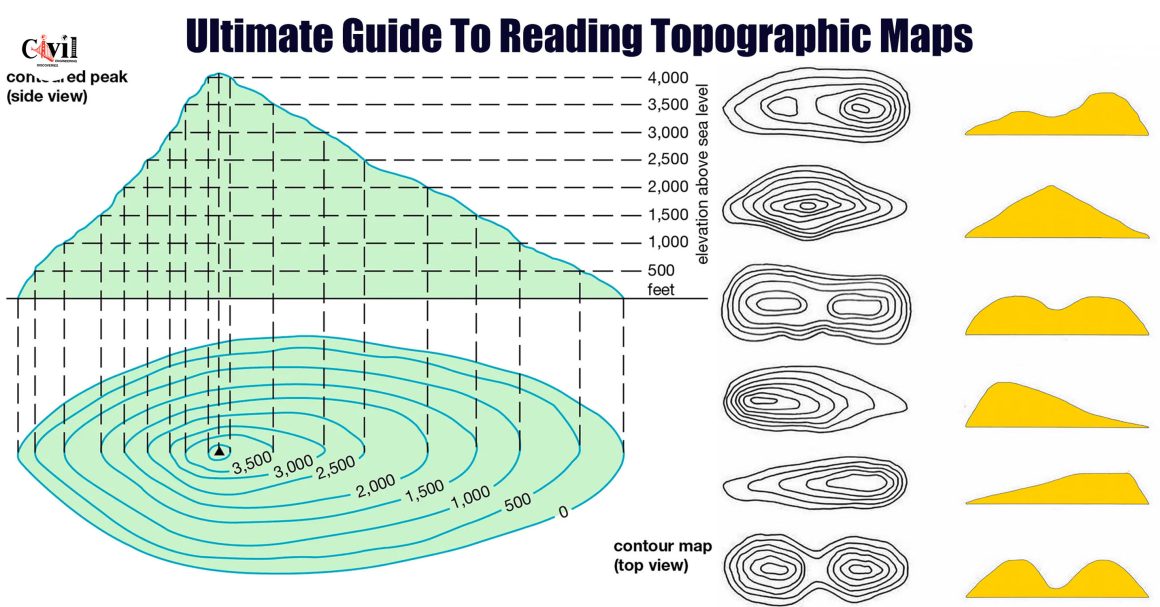
Notice two key things in the image:
- The lines form closed loops that represent the shape of the hill at different heights.
- The vertical distance in height between any two adjacent lines is consistent. This is called the contour interval.
2. The Rules of Reading Contours
Interpreting contour lines is a systematic process governed by a set of rules. We will go through the most important ones step-by-step. The following video provides a clear, practical guide to these rules. We will watch it in segments to focus on each concept.
Introduction to Topographic Maps
This video, 'Introduction to Topographic Maps' by Seth Horowitz, breaks down the core principles of reading contours. We'll start with the first essential skill: figuring out the contour interval.
Watch from 01:15 to 04:42. The narrator will explain what a contour interval is and show you how to calculate it using the labeled 'index contours'. This is the first thing you should do when looking at any new topographic map.
Rule 1: Determine the Contour Interval
As you just saw, the contour interval is the difference in elevation between adjacent contour lines. You find it by locating two labeled index contours (the thicker, darker lines), finding the difference in their elevation, and dividing that by the number of gaps between them. Knowing the interval (e.g., 20 meters) is crucial because it tells you how much you are climbing or descending as you cross each line.
Rule 2: Slope is Determined by Spacing
Now, let's look at what the spacing of the lines tells us.
Introduction to Topographic Maps
Let's continue with the same video to learn how contour spacing relates to the steepness of the terrain.
Watch from 05:17 to 06:31. Focus on the core principle: What does it mean when lines are close together versus far apart?
As the video explained, the rule is simple and intuitive:
- Closely spaced contour lines indicate a steep slope.
- Widely spaced contour lines indicate a gentle slope or flat terrain.
3. Identifying Landforms
Now that we have the two most basic rules, we can start identifying specific landforms based on the shape and pattern of the contours.
Hills and Depressions
Introduction to Topographic Maps
Let's return to our video guide to see how hills and their opposite, depressions, are shown.
Watch from 09:10 to 14:46. Pay attention to two key patterns: How concentric, closed loops represent a hill and how you can estimate the elevation of its summit. How small tick marks, called 'hachures', are used to signify a depression (like a crater or sinkhole).
To summarize:
- Hills/Mountains: A series of concentric, closed contour lines represents a hill. The smallest loop is the top. The summit's elevation is higher than the highest contour line but lower than what the next contour line would be.
- Depressions: These are shown by closed contour lines with hachure marks (short tick marks) pointing inward, indicating that the elevation is going down.
Valleys, Rivers, and Ridges
Valleys and ridges are elongated features that have very distinct and opposite contour patterns.
Introduction to Topographic Maps
This segment of the video focuses on a critical rule for identifying water flow.
Watch from 06:31 to 09:10. This section explains the 'Rule of Vs'. Focus on how the V-shape of a contour line tells you the direction of a river's flow.
The Rule of Vs is one of the most important rules in topographic map interpretation:
- Valleys/Rivers: Contour lines form a 'V' shape where they cross a stream or valley. The 'V' always points upstream, or uphill, toward the water's source.
Ridges or spurs are the high ground that extends out from a mountain or hill, often separating two valleys. Their contour pattern is the inverse of a valley.
How to Read a Topographic Map: A Beginner to Pro Guide
This short text from the 'How to Read a Topographic Map' guide provides a concise definition of ridges, as well as saddles.
Read the bulleted list under the subheading 'Contour Lines—The Shape of the Land'. Focus on the definitions for 'Ridge' and 'Saddle'.
As the text explains:
- Ridges/Spurs: Shown by U-shaped or V-shaped contour lines. Here, the closed end of the 'U' or 'V' points downhill.
- Saddles: A low point between two higher peaks. The contour lines form an hourglass shape.
Test your understanding!
You are looking at a series of V-shaped contour lines. The elevation numbers are increasing in the direction the 'V's are pointing. Are you looking at a ridge or a valley?
Show answer
You are looking at a valley. The 'Rule of Vs' states that the V-shape points upstream or uphill. Since the elevation is increasing in that direction, it confirms you are looking up a valley toward higher ground. If it were a ridge, the V-shape would point downhill, toward lower elevation numbers.
4. Consolidating the Rules
You have now been introduced to the fundamental rules for reading contours. To reinforce this in a systematic way that you prefer, the following resource provides a clear, numbered list of these characteristics.
How to Read Illinois Topographic Maps
The 'How to Read Illinois Topographic Maps' guide offers a fantastic, structured summary of contour line properties. Reading this will help solidify your understanding.
Find the heading 'Contours' (on page 16 of the PDF). Read the numbered list from 1 to 10. This list synthesizes everything we've discussed so far, from slope spacing to V-shapes and hill closures.
5. Application: Drawing a Topographic Profile
A powerful way to test and apply your understanding is to create a topographic profile. This is a cross-section, or side view, of the terrain along a specific line. It translates the 2D map back into a 3D visualization.
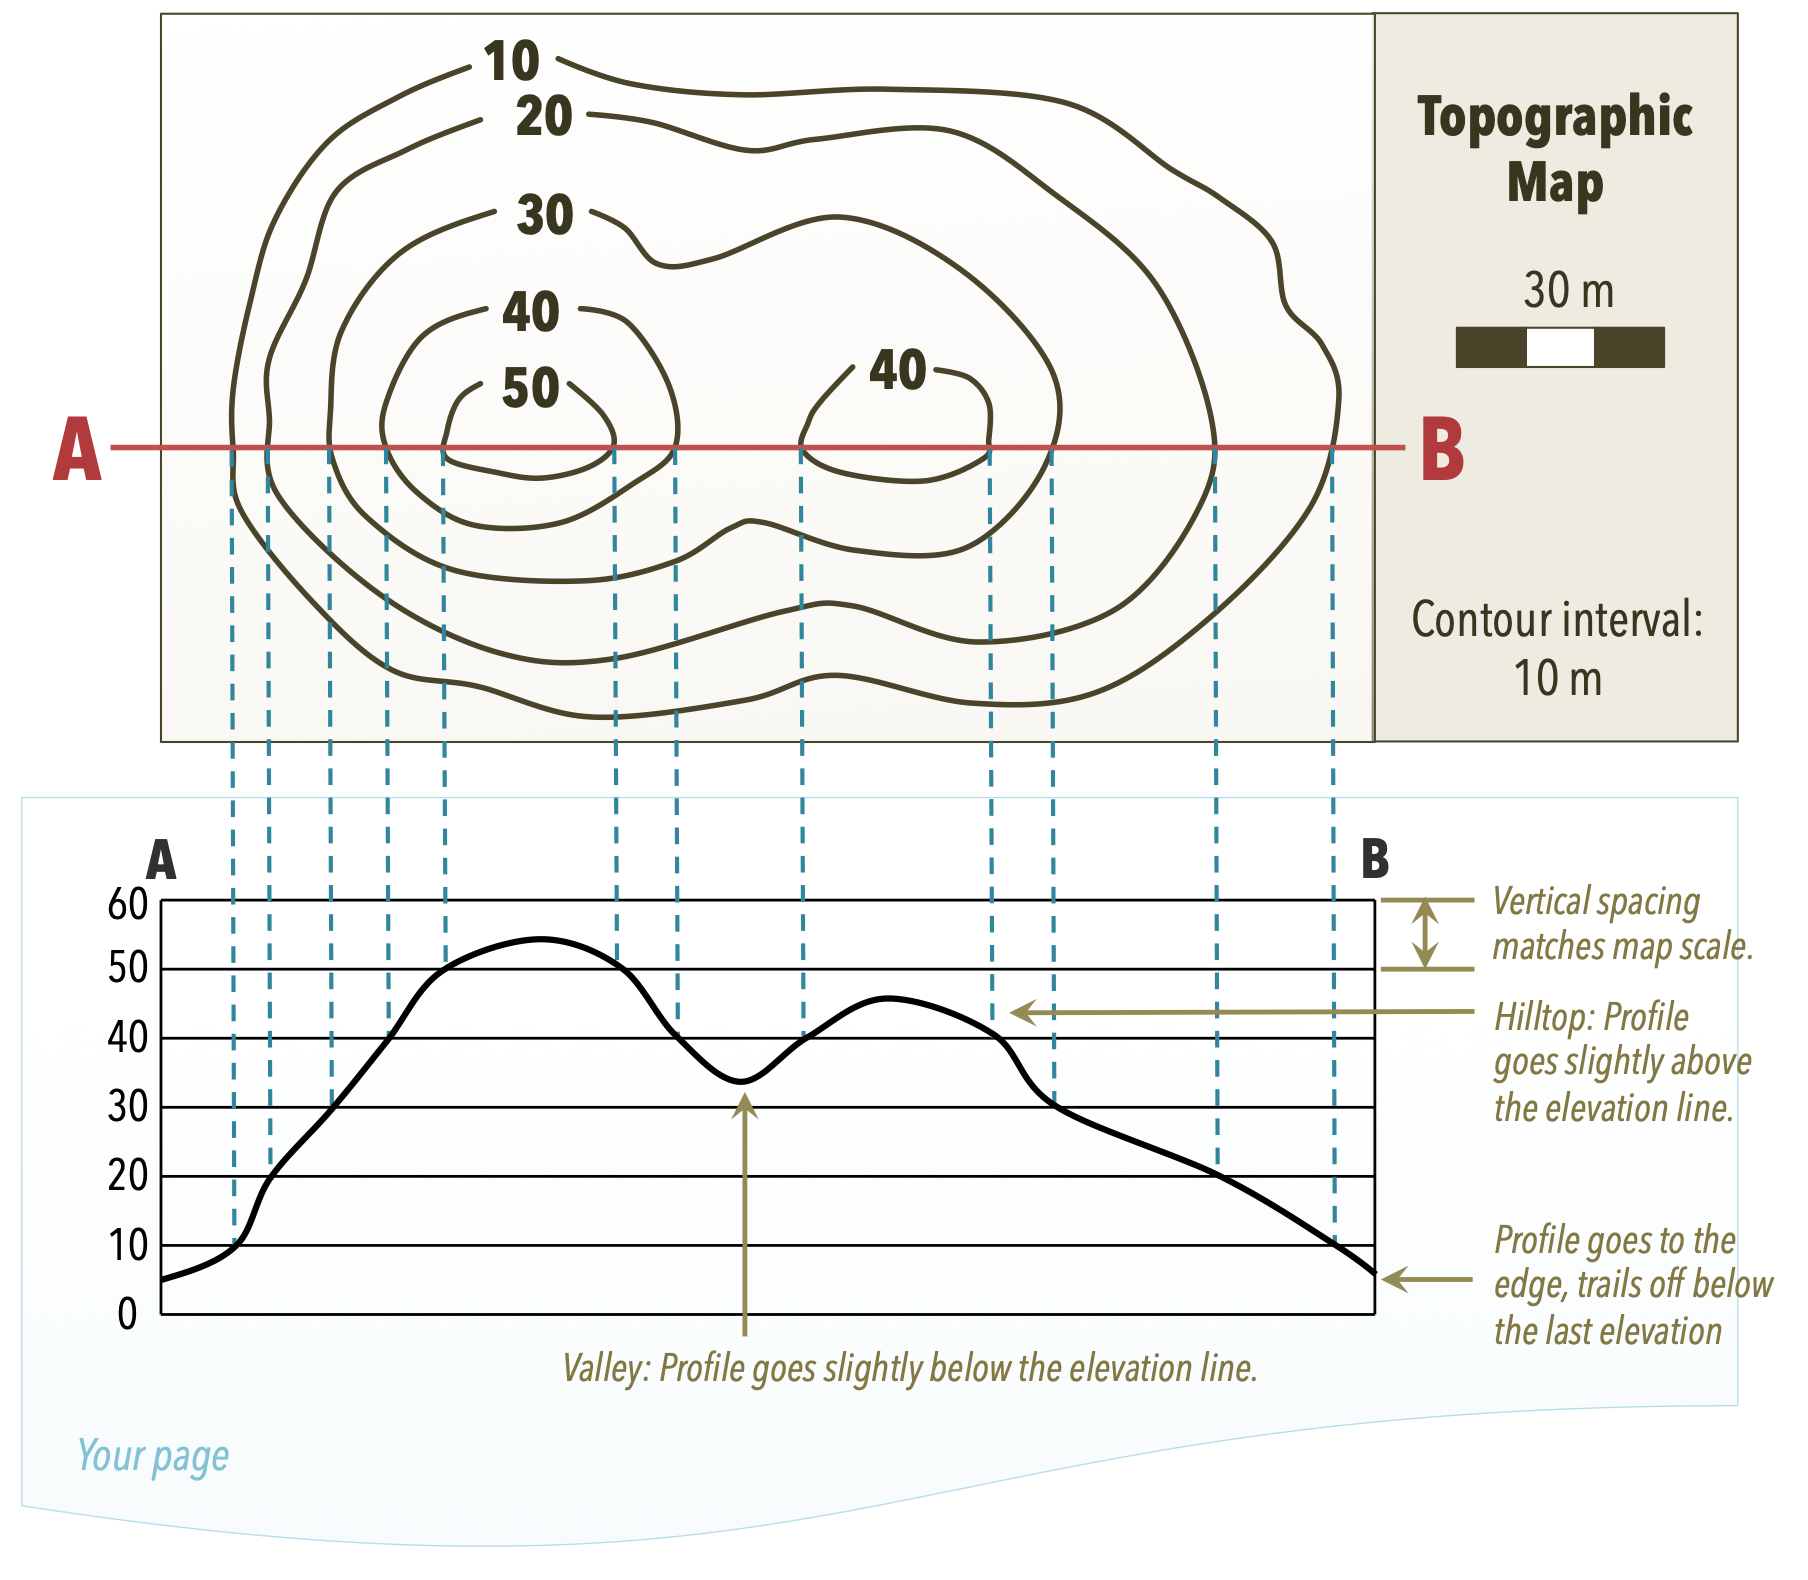
To create a profile like the one shown above:
- Lay a strip of paper along the line on the map (line A-B in the example).
- Mark on the paper every point where a contour line intersects it. Write the elevation of each line next to its mark.
- Draw a graph with a vertical axis for elevation.
- Place your marked paper strip along the bottom of the graph.
- For each mark on your paper, project a point vertically up to its corresponding elevation on the graph.
- Connect the dots with a smooth curve. The resulting line is the topographic profile of the ground.
This process forces you to actively interpret each contour line's value and spacing, cementing the connection between the map and the real-world landscape.
Conclusion
Today you've unlocked the ability to see a three-dimensional world on a two-dimensional map. By understanding a few key rules, you can now look at a topographic map and not just see squiggly brown lines, but visualize the terrain in rich detail.
Key Takeaways:
- A contour line connects points of equal elevation.
- The contour interval is the vertical distance between adjacent lines.
- Line spacing indicates slope: close lines mean a steep slope, and wide lines mean a gentle slope.
- Closed loops represent hills (or depressions if they have hachure marks).
- V-shaped contours in a valley always point uphill (upstream).
- U or V-shaped contours on a ridge always point downhill.
Preview of the Next Lesson:
We have learned how to qualitatively interpret slope (steep vs. gentle). In the next lesson, we will make this more precise. The learning outcome is to determine slope and relief from contour patterns. You will learn how to calculate the numerical gradient of a slope and to quantify the relief of an area, adding another layer of analytical depth to your map-reading skills.