Hello! Welcome back to our study of the atmosphere.
In our last lesson, we explored the fundamental factors that control temperature across the globe, such as latitude, altitude, and the contrast between land and water. We learned why some places are warm and others are cold. Today, we'll focus on the essential skill of visualizing and interpreting these patterns.
This lesson directly addresses the learning outcome: Interpret temperature distribution patterns using isotherms on a map. You will learn what isotherms are and how to read them to understand the geography of temperature, a core skill for anyone studying climatology and physical geography. This bridges our understanding of heat distribution with the practical analysis of weather and climate maps.
What is an Isotherm?
An isotherm is a line on a map that connects points having the same temperature at a given time or for a certain period. The word comes from Greek: isos meaning "equal" and therme meaning "heat."
Isotherms are a type of isoline (or isopleth), a general term for any line on a map connecting points of equal value. You will encounter many types of isolines in geography, such as isobars (equal pressure) and contours (equal elevation), so understanding this first example is very important.
To start, let's watch a brief, clear introduction.
What are Isotherms? | Class 7 - Geography | Learn With BYJU'S
This short video, 'What are Isotherms?', from BYJU'S provides a simple and effective visual demonstration of what isotherms are and how they are drawn. It's a perfect starting point.
Please watch from the beginning to 02:36. Focus on the basic definition and the general observations made about how isotherms behave.
The video shows that to draw an isotherm, meteorologists and climatologists take temperature readings from many different weather stations. They then draw a smooth line connecting all places with the same temperature.
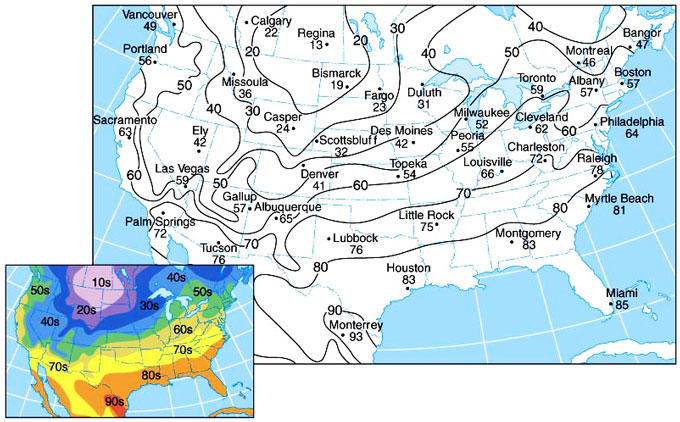
How to Interpret Isotherm Maps
Now that you know what an isotherm is, let's explore how to extract detailed information from an isotherm map. The patterns, shapes, and spacing of these lines reveal a great deal about the geography of a region.
Explaining Patterns of Air Temperature
The article 'Explaining Patterns of Air Temperature' from Geo LibreTexts provides a clear explanation of how to read isotherm maps. It connects the visual patterns directly back to the physical factors we discussed in the last lesson.
Please read the first part of the article, under the heading 'Mapping Patterns of Air Temperature'. Pay close attention to the explanation of isotherm spacing and the description of the January and July maps.
Let's break down the two most important principles from that reading:
1. The Temperature Gradient (Spacing of Isotherms)
The distance between isotherms tells you how quickly the temperature changes over a certain distance. This is called the temperature gradient.
- Closely spaced isotherms indicate a steep temperature gradient. This means the temperature is changing rapidly over a short distance. You would feel this change as you travel across this area.
- Widely spaced isotherms indicate a gentle temperature gradient. The temperature is changing very slowly over a large area.
2. The Influence of Land and Water (Bending of Isotherms)
As the reading explained, isotherms are not straight lines. They bend significantly, especially when they cross from an ocean to a continent. This is a direct visual representation of the concept of continentality we learned previously.
- In winter (January in the Northern Hemisphere), land cools down much more than the ocean. Therefore, isotherms bend towards the equator when they cross over a continent, "chasing" the warmer temperatures to the south.
- In summer (July in the Northern Hemisphere), land heats up much more than the ocean. Isotherms bend towards the poles when they cross over a continent, following the much hotter inland temperatures northward.
Global Isotherm Patterns: A World View
Let's apply these principles to global maps. The image below shows the average global temperatures for January and July.

Take a moment to analyze these two maps using what you've just learned:
- Observe the Bending: Look at the Northern Hemisphere. Can you see how the isotherms bend south over North America and Asia in the January map? And how they bend north over the same continents in the July map?
- Compare Hemispheres: Notice how much smoother and more parallel to the equator the isotherms are in the Southern Hemisphere. This is because it is mostly covered by ocean, which heats and cools uniformly. The large landmasses of the Northern Hemisphere cause much more complex, bent patterns.
- Identify the Thermal Equator: The line of highest temperature (the "thermal equator") shifts north and south with the seasons. In July, the hottest areas are north of the geographic equator (e.g., in the Sahara Desert), and in January, they shift south.
Test your understanding!
On the January map above, locate the North Atlantic Ocean between North America and Europe. You'll see a warm ocean current called the Gulf Stream flows northeast here. How do the isotherms behave over this area, and what does it tell you about the influence of the current?
Show answer
Over the North Atlantic, the isotherms bend significantly northward. For example, the 0°C isotherm, which cuts through the continental United States, is pushed far up towards Iceland and the Norwegian Sea. This shows that the warm water of the Gulf Stream is transporting a huge amount of heat poleward, creating an unusually mild climate for coastal Northwestern Europe compared to other locations at the same latitude (like inland Canada).
A Deeper Look: The Process of Map Analysis
You've shown a great interest in a systematic, deep understanding of topics. So, let's look at two important details that go into creating and analyzing these maps.
1. Correcting for Altitude
One tricky aspect of global temperature maps is the effect of altitude. As we know, temperature decreases with height (the normal lapse rate of approx. 6.5°C per 1,000 meters). If we mapped the actual surface temperatures, mountainous areas like the Himalayas or the Andes would always appear as extremely cold spots, which would hide the broader climatic patterns caused by latitude and continentality.
To solve this, climatologists often standardize temperatures by reducing them to sea level. They calculate what the temperature at a high-altitude station would be if it were at sea level. For a station at 2,000 meters, they would add approximately 13°C (2 x 6.5°C) to its recorded temperature before plotting it on the map.
This is why an isotherm map might show a 15°C line running over a mountain plateau where the actual temperature is only 2°C. The map is not showing the real temperature; it's showing a standardized temperature to make large-scale patterns easier to compare.
2. How Isotherms are Drawn
The process of creating an isotherm map from raw data is a fundamental type of spatial analysis. The resource below, from a practical meteorology textbook, describes this process.
9 WEATHER REPORTS & MAP ANALYSIS
This excerpt from 'Practical Meteorology' explains the analytical process of creating isopleths, including isotherms. It details the rules and logic used to turn a set of discrete data points into a coherent map.
Read the section titled 'Map Analysis, Plotting & Isoplething' (pages 280-281). Focus on the rules for drawing isopleths and look at Figure 9.17, which illustrates the process from raw data to a finished analysis.
The key rules for drawing any isopleth, including an isotherm, are:
- Constant Interval: They are drawn at a regular interval (e.g., every 5°C).
- Interpolation: The line's position is estimated between points. A 10°C isotherm must pass halfway between a point at 8°C and a point at 12°C.
- No Crossing: Isotherms can never cross each other. A single point on the map cannot have two different temperatures at the same time.
- Continuity: The lines must either form a closed loop or run to the edge of the map. They never just stop in the middle.
Conclusion
Today we unlocked the language of isotherm maps. You learned how to interpret these important tools to see the spatial patterns of temperature that we've been discussing.
Key Takeaways:
- Isotherms are lines connecting points of equal temperature, standardized to sea level for large-scale maps.
- The spacing of isotherms indicates the temperature gradient: close lines mean rapid temperature change, while wide lines mean slow change.
- Isotherms bend over continents, moving equatorward in winter and poleward in summer, visually demonstrating the principle of continentality.
- Global isotherm maps clearly show patterns related to latitude, the distribution of land and water, and the influence of ocean currents.
Preview of the Next Lesson:
The uneven heating of the Earth, which we can now visualize with isotherms, is the ultimate driver of almost all weather. This temperature difference from place to place creates differences in atmospheric pressure. In our next lesson, we will begin our study of atmospheric dynamics by learning to explain the concept of atmospheric pressure and the factors that affect it. We will see how temperature and pressure are intimately linked to create the winds that circulate our globe.