Hello! In our last session, we explored the digital marketing funnel, establishing the strategic path from awareness to retention. You now have a framework for guiding potential customers on their journey with a brand. Today, we'll equip you with the tools to measure progress along that path. If the funnel is the map, then metrics are the compass and speedometer, telling you how far you've come and how fast you're moving.
This lesson is fundamental to your goal of becoming a professional marketer. In the world of digital marketing, and especially in performance-driven fields like Meta Ads, success is defined by data. You need to speak the language of metrics to understand campaign performance, justify your strategies, and make decisions that drive real business results. We will define the key metrics that every marketer must know: impressions, reach, engagement rate, click-through rate (CTR), conversion rate, and Return on Investment (ROI).
A Quick Tour of Key Metrics
To start, let's get a high-level overview. The world of marketing metrics can seem filled with jargon, but the core concepts are quite straightforward. The following video from Hootsuite, a major social media management platform, provides a clear and concise introduction to the most important metrics we'll be discussing today.
Social Media Metrics You Should Know
Watch the entire video. As you watch, notice how each metric answers a different question about your performance: Engagement Rate: How much do people like my content? Impressions & Reach: Who saw my content, and how many times? Click-Through Rate: Is my content compelling enough to make people act? Conversion Rate: Are those actions leading to business results?
This video provides a great foundation. Now, let's break down each of these concepts in more detail.
Awareness Metrics: Are We Being Seen?
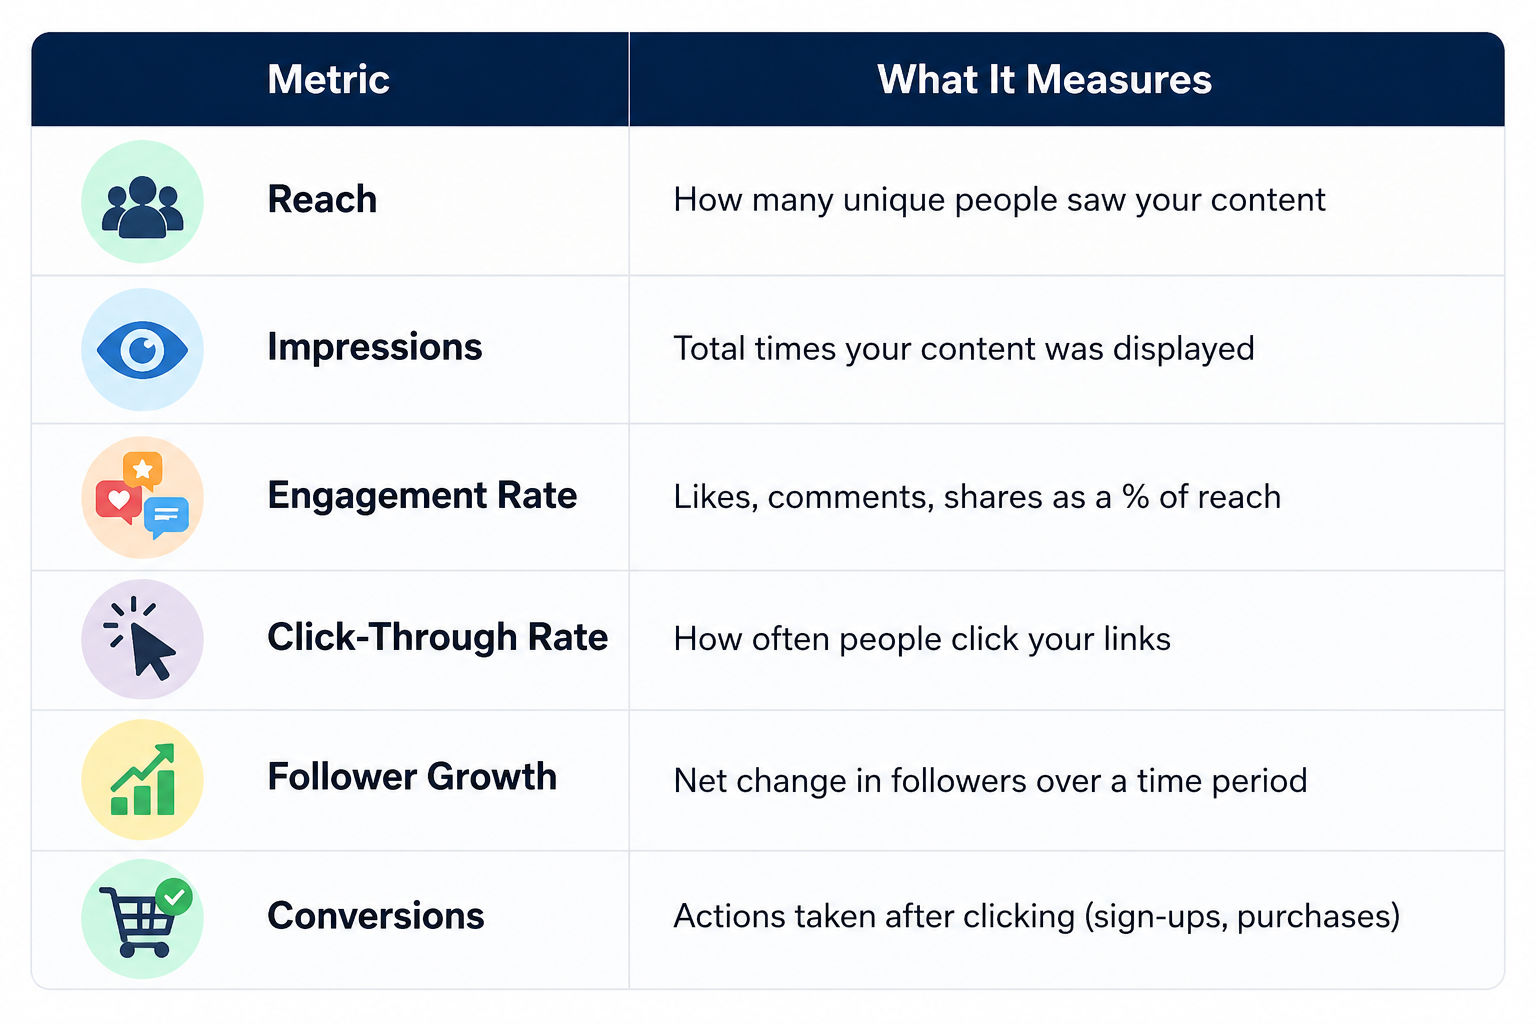
At the top of the funnel (Awareness), your primary goal is to get your content in front of new people. The two most basic metrics for measuring this are Reach and Impressions. It's crucial to understand the difference.
- Impressions: The total number of times your content was displayed on a screen. If one person sees the same ad five times, that counts as five impressions.
- Reach: The number of unique people who saw your content. If one person sees the same ad five times, that counts as one reach.
Think of it like a billboard on a highway. Reach is the number of different drivers who passed it this week. Impressions are the total number of times the billboard was seen, including the commuter who drives by every day. Impressions measure frequency and presence, while Reach measures unique audience size.
For a more detailed explanation, let's turn to an article from the marketing software company Sprinklr.
Social Media Metrics: All Types Explained - Sprinklr
In this article, read the sections on Impressions and Reach.
Start with the section on Impressions, which explains that this metric is about content being displayed. Then, find the section on "Social media engagement metrics" and read the part on Reach, which highlights the key distinction between the two.
Interest & Engagement Metrics: Is Our Content Resonating?
Once people see your content, the next question is: do they care? Metrics for the consideration stage of the funnel measure interaction and interest.
Engagement Rate
Engagement Rate measures the percentage of your audience that interacts with your content. These interactions include likes, comments, shares, and saves. A high engagement rate tells platform algorithms (like Meta's) that your content is valuable, which can lead to more organic visibility. There are a few ways to calculate it, but a common formula is:
Click-Through Rate (CTR)
CTR is one of the most important metrics for moving users down the funnel. It measures the percentage of people who saw your content and then clicked a specific link within it. A low CTR might signal a disconnect between your ad creative and your audience's interests, or that your call-to-action isn't compelling enough. The formula is:
The following image provides a perfect visual breakdown of this calculation.

Action Metrics: Are We Driving Results?
At the bottom of the funnel, you're focused on conversion. This is where your previous experience in lead generation comes directly into play.
Conversion Rate
A conversion is any desired action a user takes. While it often means a purchase, it can also be a lead form submission, a newsletter signup, or a file download. The Conversion Rate is the percentage of people who completed that action after clicking on your ad or link. It's a critical measure of how effectively your marketing translates into tangible business outcomes.
To dive deeper into CTR and Conversion Rate, let's go back to the Sprinklr article.
Social Media Metrics: All Types Explained - Sprinklr
This time, focus on the sections that cover CTR, Engagement Rate, and Conversion Rate.
First, read the section on Click-Through Rate to see how it's calculated. Next, jump to the "Social media engagement metrics" category and read the definition and formula for Engagement Rate. Finally, in the "Social media conversion metrics" category, review the definition and formula for Conversion Rate.
Business Impact: Was It Worth It?
Finally, we need to tie our marketing efforts to financial results. This is measured by Return on Investment.
Return on Investment (ROI) and Return on Ad Spend (ROAS)
ROI is a broad business metric that calculates the total profit generated from a marketing investment. The general formula is:
For paid advertising, marketers often use a more specific metric: Return on Ad Spend (ROAS). This is a metric you will live and breathe when managing Meta Ad campaigns. It measures the gross revenue generated for every dollar spent on advertising, making it a direct indicator of campaign profitability.
A ROAS of 3:1, for example, means you earned $3 in revenue for every $1 you spent on ads.
Let's get a final, clear definition of this crucial metric from an article on the Small Business Expo blog.
7 Metrics For Social Media Marketing That Drive Revenue
This article does a great job of framing metrics in terms of business value. We will focus on its definition of ROAS.
Scroll down to point #7, Return on Ad Spend, and read the paragraph explaining what it is and why it's the "ultimate scorecard" for paid traffic.
Conclusion
Today, we've defined the foundational metrics of digital marketing. Understanding these numbers is not just about creating reports; it's about making smarter strategic decisions, proving the value of your work, and optimizing campaigns for better performance.
Key Takeaways:
- Awareness Metrics (Top of Funnel): Impressions (total views) and Reach (unique viewers) measure your content's visibility.
- Interest Metrics (Middle of Funnel): Engagement Rate (likes, comments, shares) shows how well your content resonates, while Click-Through Rate (CTR) measures how many people act on it.
- Action Metrics (Bottom of Funnel): Conversion Rate tracks the percentage of users who complete a specific, valuable action (like a purchase or lead submission).
- Business Impact Metric: Return on Ad Spend (ROAS) is the critical measure for paid campaigns, showing the revenue generated for every dollar spent.
Now that we know how to measure our marketing efforts, we need to ensure we're directing those efforts toward the right people. In our next lesson, we'll dive into the concept of a target audience, exploring how to identify and understand the specific group of people most likely to become your customers.