Hello! Welcome to your second lesson in the Financial Accounting module.
In our previous lesson, we established the fundamental principle of accounting: the equation Assets = Liabilities + Equity. You learned how this equation provides a logical framework for analyzing any business transaction, always remaining in balance.
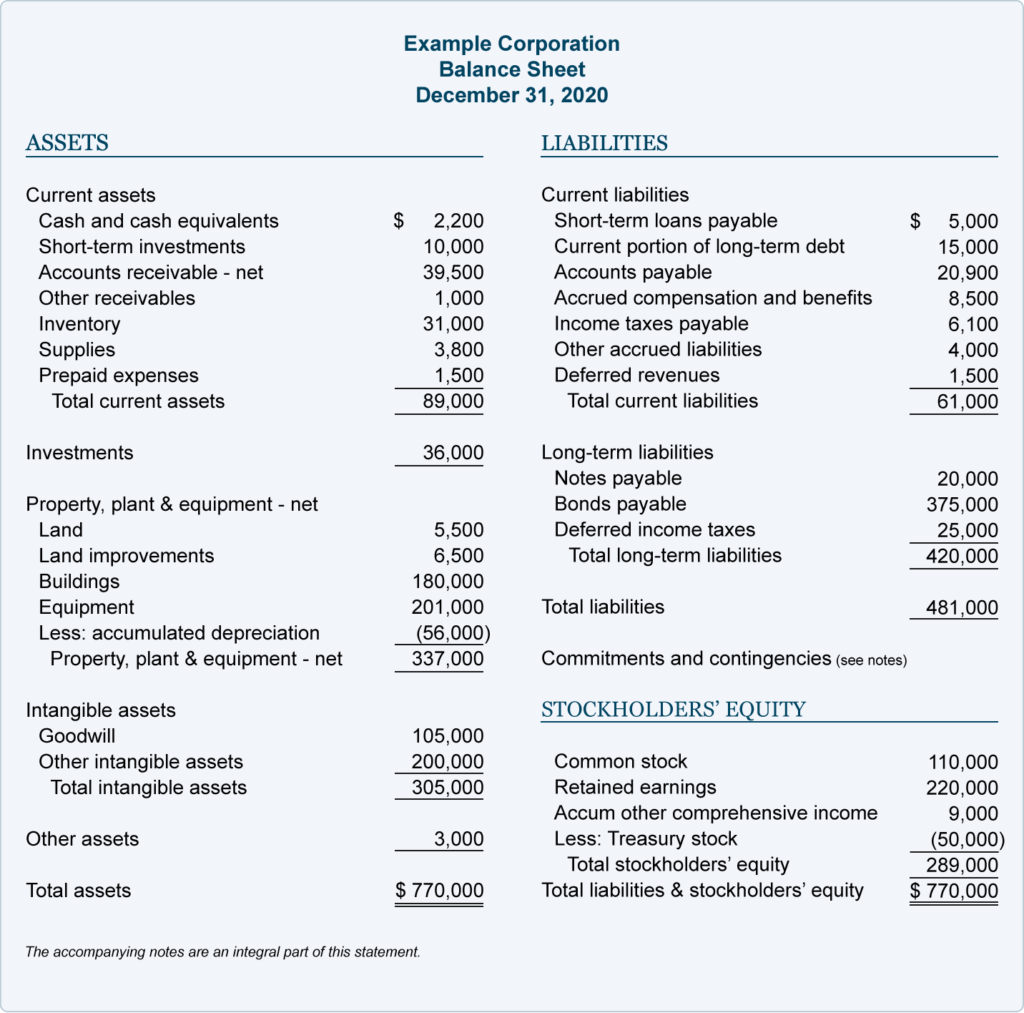
Today, we will see that equation come to life. The balance sheet is the financial statement that is a direct representation of the accounting equation. It provides a snapshot of a company's financial condition at a single moment in time. For you as a future corporate lawyer, the ability to read and understand a balance sheet is non-negotiable. It's the key to assessing a client's financial stability, performing due diligence in an acquisition, or advising a company in financial distress.
By the end of this lesson, you will be able to interpret a balance sheet to assess a corporation's financial position and solvency.
1. The Balance Sheet: A Financial Snapshot
As we've mentioned, the balance sheet is a snapshot. It tells you what a company owns (its assets) and what it owes (its liabilities) on a specific day. The difference between these two is the owners' stake (equity).
To begin, let's read a clear overview from Archway Research's 'Finance 101 for Lawyers' series. This text introduces the core components and guiding principles of the balance sheet, using a helpful analogy.
Please read the 'Guiding Principles' section. Pay close attention to the definitions of Assets, Liabilities, and Equity, and the distinction between a balance sheet (a snapshot) and an income statement (a movie).
The reading confirms the central rule: Total Assets must always equal Total Liabilities + Total Equity. This isn't just an accounting convention; it's a logical truth. Every resource the company has must have been financed from one of two sources: debt (liabilities) or the owners' investment (equity).

2. Deconstructing the Balance Sheet
To interpret a balance sheet, you first need to understand its components. The accounts are not listed randomly; they are ordered by liquidity—how quickly they can be converted into cash.
Let's watch a detailed breakdown of each section. This video takes the perspective of a Chief Financial Officer (CFO), explaining not just what each line item is, but also the risks and questions a financial professional would consider. This aligns with a lawyer's need to spot potential issues.
How to Read & Analyze the Balance Sheet Like a CFO | The Complete Guide to Balance Sheet Analysis
This video from 'The Financial Controller' provides a comprehensive guide to analyzing a balance sheet. We will watch it in parts.
First, watch the segment on Assets, from timestamp 02:36 to 12:50. As you watch, focus on the distinction between 'Current Assets' and 'Non-Current Assets' and the key examples for each (Cash, Accounts Receivable, Inventory, and PP&E).
As you just saw, the main categories are:
Assets (What the Company Owns)
- Current Assets: Resources expected to be converted to cash, sold, or used up within one year. They are listed in order of liquidity.
- Cash and Cash Equivalents: The most liquid asset.
- Accounts Receivable (A/R): Money owed to the company by its customers for goods or services already delivered. A key risk here, as the video noted, is the likelihood of collection.
- Inventory: Raw materials, work-in-progress, and finished goods waiting to be sold. The risk is that it could become obsolete or expire.
- Non-Current Assets: Long-term resources not expected to be converted to cash within a year.
- Property, Plant, and Equipment (PP&E): Also known as fixed assets. These are the tangible, long-term assets used to run the business, like buildings, machinery, and vehicles. Their value on the balance sheet is their historical cost minus accumulated depreciation.
Now, let's look at the other side of the equation.
How to Read & Analyze the Balance Sheet Like a CFO | The Complete Guide to Balance Sheet Analysis
Let's continue with the same video to understand Liabilities.
Now, watch the segment on Liabilities, from timestamp 12:50 to 17:08. Focus on the distinction between 'Current Liabilities' and 'Non-Current Liabilities'.
Liabilities (What the Company Owes)
- Current Liabilities: Obligations due to be paid within one year.
- Accounts Payable (A/P): Money the company owes to its suppliers for goods or services it has already received.
- Deferred Revenue (or Unearned Revenue): Cash received from a customer for a product or service that has not yet been delivered. This is a liability because the company has an obligation to provide the service or return the money.
- Non-Current Liabilities: Obligations due more than one year from the balance sheet date.
- Long-Term Debt: Loans, bonds, or other borrowings that mature in more than one year.
A quick but important note for lawyers: You may wonder where potential lawsuit losses appear. These are called contingent liabilities. Because their outcome and amount are uncertain, they are usually not listed on the balance sheet itself. Instead, they must be disclosed in the footnotes to the financial statements—a critical place for lawyers to look.
Shareholders' Equity (The Owners' Claim)
This is the residual interest in the assets after deducting liabilities. As we covered in the last lesson, its main components are:
- Common Stock / Paid-in Capital: The amount of money shareholders invested directly into the company in exchange for stock.
- Retained Earnings: The cumulative net income the company has earned over its lifetime, minus any dividends it has paid out to shareholders. This is the link between the income statement and the balance sheet.
Here is an example of a complete balance sheet, putting all these pieces together.
Test your understanding!
A company's balance sheet shows Current Assets of $100,000 and Current Liabilities of $120,000. What initial observation can you make about the company's short-term financial position?
Show answer
The company's Current Liabilities exceed its Current Assets. This is a potential red flag indicating a liquidity problem. It means the company has more obligations due within the next year than it has assets expected to be converted to cash within that same period. It may struggle to pay its short-term bills without securing additional financing or liquidating long-term assets.
3. Assessing Financial Position and Solvency
Reading a balance sheet is one thing; interpreting it is another. Your goal is to assess the company's financial health. We do this by looking at two key concepts: liquidity and solvency.
This video from 'The Finance Storyteller' provides a brilliant and simple metaphor to distinguish between liquidity and solvency, before diving into a real-world case study.
Please watch from the beginning to 02:29. Focus on the 'glasses of water' metaphor to understand the difference between being insolvent and being illiquid.
To summarize the excellent metaphor from the video:
- Solvency: Having more assets than liabilities (the total amount of water in the asset glass is more than in the liability glass). A company that is insolvent has negative equity and is, for legal purposes, bankrupt.
- Liquidity: Having enough liquid assets (like cash) to meet short-term obligations (the water in the asset glass is not frozen). A company can be solvent but illiquid, meaning it owns valuable assets but can't readily access cash to pay its bills.
How do we measure this? We use financial ratios.
Key Ratios for Assessing Health
1. The Current Ratio (A Measure of Liquidity)
This ratio measures a company's ability to cover its short-term liabilities with its short-term assets.
- A ratio greater than 1 is generally considered healthy, suggesting the company can cover its short-term obligations.
- A ratio less than 1, as in our mini-exercise, signals potential liquidity issues.
2. Debt-to-Equity Ratio (A Measure of Solvency & Leverage)
This ratio measures how much of the company is financed by debt versus by the owners' equity. It's a primary indicator of long-term solvency risk.
- A high ratio indicates high leverage—the company relies heavily on debt. While debt can fuel growth, it also increases risk. If business slows down, a highly leveraged company can quickly become insolvent.
Let's see how these ratios are used in practice.
How to Read & Analyze the Balance Sheet Like a CFO | The Complete Guide to Balance Sheet Analysis
Let's return to 'The Financial Controller' video to see how a CFO uses ratios to analyze a company's debt structure.
Watch from 17:08 to 20:02. This segment demonstrates the calculation and interpretation of the Debt-to-Equity ratio and another useful metric, the Interest Coverage Ratio.
Case Study: The Downfall of JC Penney
Financial ratios are not just academic exercises. They are powerful diagnostic tools. The decline of a company is often written on its balance sheet long before it files for bankruptcy.
We'll now watch the rest of 'The Finance Storyteller' video on JC Penney. This is a perfect practical application of everything we've discussed. It shows how analyzing trends in the balance sheet and key ratios could have predicted the company's insolvency.
Watch from 02:29 to 11:30. Pay close attention to what happened to JC Penney's balance sheet over time (shrinking assets, eroding equity) and how its Debt-to-Equity ratio 'exploded'. This is a prime example of assessing solvency.
The JC Penney case powerfully illustrates that a single balance sheet gives you a snapshot, but the trend across multiple balance sheets tells a story. As a lawyer, seeing equity shrink and debt-to-equity rise year after year is a clear warning of deep financial trouble.
Conclusion
Today, you've moved from understanding the accounting equation in theory to applying it in practice through the balance sheet. This statement is the foundation for understanding a company's financial DNA.
Key Takeaways:
- The balance sheet is a snapshot of the accounting equation, Assets = Liabilities + Equity, on a specific date.
- Assets and liabilities are classified as current (less than one year) or non-current (more than one year), which is key to assessing liquidity.
- Solvency refers to a company's long-term viability (Assets > Liabilities), while liquidity refers to its short-term ability to pay its bills. A company can be solvent but illiquid.
- Simple ratios like the Current Ratio (for liquidity) and Debt-to-Equity Ratio (for solvency) are essential tools for transforming the raw numbers on a balance sheet into actionable insights.
- Analyzing trends in the balance sheet over several years is a powerful way to assess a company's financial trajectory.
In our next lesson, we will explore the Income Statement. This is the "movie" that the first reading mentioned, showing a company's financial performance over a period of time. You will see how the profit or loss generated on the income statement directly connects back to the balance sheet by changing the Retained Earnings account in the equity section.