Welcome back. In our last session, we explored the theoretical foundations of distributed tracing, dissecting the concepts of traces, spans, and context propagation. We established why we need to trace requests across service boundaries and what the resulting data looks like.
Today, we transition from theory to practice. This lesson is about getting your hands on the keyboard and learning how to generate the very trace data we've been discussing. You will learn how to instrument a sample application using the OpenTelemetry Software Development Kit (SDK). We will cover the essential SDK components, walk through the process of creating and enriching spans, and discuss the different strategies for applying instrumentation, from fully automatic to granularly manual. Your experience as a programmer will be central here, as we'll be looking at the code that makes observability possible.
The Anatomy of an Instrumentation SDK
Before we write any code, let's establish a mental model of the moving parts. When you add OpenTelemetry to your application, you are integrating its SDK. The SDK is a set of libraries that provides the tools to generate and export telemetry data.
At a high level, the flow looks like this:
- Your application code uses the OpenTelemetry API to create spans.
- The SDK implements this API and handles the processing of those spans.
- A Span Processor within the SDK batches the spans for efficiency.
- An Exporter sends the batched spans to a backend, like Jaeger or an OpenTelemetry Collector.
The following diagram illustrates this pipeline. Your application client is on the far left, and the SDK is the component responsible for capturing telemetry and passing it to a collector.

The three most important components you will configure in your code are:
- TracerProvider: This is the main entry point and configuration hub for the SDK. It's the factory that creates
Tracerobjects, which in turn create spans. You typically configure it once when your application starts. - Exporter: This component is responsible for sending your trace data out of the application. The most common choice is the OTLP (OpenTelemetry Protocol) exporter, which can send data to the OpenTelemetry Collector or any compatible backend.
- SpanProcessor: This component sits between the span creation and the exporter. It provides a hook for processing spans. The most common implementation is the
BatchSpanProcessor, which groups spans into batches before sending them to the exporter. This is far more efficient for production workloads than sending each span individually.
A Practical Walkthrough: Instrumenting a Go Application
Let's put these concepts into practice by instrumenting a simple web service written in Go. While we will focus on Go, the core concepts and patterns are identical across all languages supported by OpenTelemetry, including Java, Python, and Node.js.
The following video, "Implementing Distributed Tracing in Golang with OpenTelemetry," provides an excellent end-to-end demonstration. We will use it as a guide, breaking down the key steps and supplementing with code snippets for clarity.
Implementing Distributed Tracing in Golang with OpenTelemetry
This video walks through the entire process of instrumenting a Go application, from setting up the tracer to creating nested spans across different application layers.
We will refer to specific segments of this video as we cover each step. You don't need to watch it all at once; we will use it to illustrate the concepts we discuss.
Step 1: Initializing the Tracer Provider
The first step in instrumenting any application is to initialize and configure the TracerProvider. This is typically done in your application's startup routine (e.g., the main function). This setup involves creating the exporter, the span processor, and the provider itself, then registering it as the global provider for your application.
The video demonstrates this process from BatchSpanProcessor, and configures a Resource to identify the service name (order-api).
The resource below provides a well-structured, production-ready example of this initialization in Go. Pay close attention to the comments, which explain the purpose of each configuration parameter.
How to Minimize OpenTelemetry Performance Overhead in Production
Although the article is about performance, it contains excellent, heavily commented examples for setting up the OpenTelemetry SDK in multiple languages. We'll use it for our code references.
Find the "Go Implementation with Async Export" section. Read through the initTracer function, focusing on how the exporter is created, how the BatchSpanProcessor is configured, and how they are all combined to create the TracerProvider.
The fundamental sequence is:
- Configure and create an
Exporter. - Configure and create a
SpanProcessor, passing the exporter to it. - Configure and create a
TracerProvider, passing the span processor to it. - Set this provider as the global one using
otel.SetTracerProvider(tp).
Step 2: Creating Spans
Once the provider is initialized, you can start creating spans. To do this, you first get a Tracer instance from the global provider. A Tracer is typically named after the package or component it instruments.
tracer := otel.Tracer("my.app.component")
Then, you use the tracer to start a span. The standard pattern is to start a span, defer its End() call, and then perform the work you want to measure.
ctx, span := tracer.Start(ctx, "MyOperationName")
defer span.End()

// ... perform the work for MyOperationName ...
The video demonstrates creating the first span in the controller layer at defer span.End() is a crucial idiom; it ensures that the span is closed and its duration is recorded, even if the code within it panics.
Step 3: Enriching Spans with Attributes and Events
A span is more than just a timer; it's a structured log containing valuable context. You can add this context using attributes and events.
-
Attributes are key-value pairs that describe the operation. They are indexed and can be used for filtering and searching in your observability backend. For example, you might add the
http.method,http.status_code, or a business-specific ID likeorder.id.span.SetAttributes(attribute.String("order.id", "12345")) -
Events are timestamped messages within a span, similar to a traditional log line. They are useful for recording significant moments during the operation's execution.
span.AddEvent("Calculating tax")
The video shows a great example of adding an order.id attribute at Error (
Step 4: Creating Nested Spans
A single trace is composed of a tree of spans. To build this tree within a single process, you simply start a new span within the context of an existing one. The SDK handles the parent-child relationship automatically.
This is best illustrated by instrumenting the different layers of an application. The incoming request is handled by a controller, which calls a service, which in turn calls a repository. Each of these layers should have its own span.
The video provides a perfect walkthrough of this:
Controller Span : The root span for the request is created in the controller.Service Span : Inside the controller span, a call is made to the service layer, which creates its own "service" span. This automatically becomes a child of the controller span.Repository Span : The service then calls the repository, which creates a "repository" span, becoming a child of the service span.
When visualized, this creates a waterfall diagram showing the time spent in each layer of the application, as seen in the video at
Manual vs. Automatic Instrumentation
What we have just walked through is manual instrumentation. It gives you complete control but requires you to modify your application's source code. For an experienced engineer, this level of control is often desirable for instrumenting critical business logic.
However, much of the boilerplate instrumentation for common libraries (HTTP servers/clients, database drivers, message queues) can be handled automatically. This is called automatic instrumentation.
- In Java, this is often achieved with a Java agent (
-javaagent), a special JAR that attaches to your application at startup and injects bytecode to create spans for supported libraries, requiring zero code changes. - In Python, Go, and Node.js, this is typically done by using specific "instrumentation libraries" that wrap common modules (e.g., an HTTP client) and add the tracing logic.
The following article on instrumenting Spring Boot applications provides an excellent overview of the different approaches.
Instrumenting Spring Boot Apps with OpenTelemetry - evoila US
This article clearly lays out the three main strategies for instrumentation in the Java ecosystem, which are conceptually applicable to other languages as well.
Read the section on Zero-Code Instrumentation to understand how the Java agent works. Next, review Low-Code Instrumentation, which uses annotations like @WithSpan to reduce boilerplate for custom spans. Finally, read the section on Manual Instrumentation, which describes the approach we've been practicing in this lesson.
The key takeaway is that you don't have to choose just one. A production-grade instrumentation strategy is often a hybrid: use automatic instrumentation for broad coverage of your stack and then apply targeted manual instrumentation for critical business workflows to add specific attributes and events.
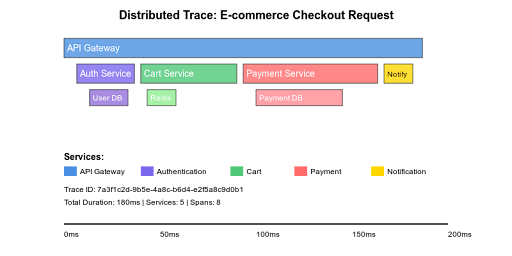
The following image of an e-commerce checkout trace illustrates a realistic outcome. The spans for the API Gateway, database calls, and Redis would likely be generated by automatic instrumentation, while the spans for "Cart Service" and "Payment Service" might be manually created to add business-specific attributes like item count or payment method.
Conclusion
In this lesson, we bridged the gap between the theory of distributed tracing and its practical implementation. You've learned how to use the OpenTelemetry SDK to begin generating rich, structured trace data from within your application.
Here are the key takeaways:
- The core OpenTelemetry SDK components are the TracerProvider, Exporter, and SpanProcessor, which you configure at application startup.
- You create spans using a Tracer instance and the
tracer.Start()pattern, ensuring spans are always ended. - Spans can be enriched with attributes (key-value metadata) and events (timestamped logs) to add critical context for debugging.
- You can build a complete picture of a request's lifecycle by creating nested spans across different layers of your application.
- Automatic instrumentation provides broad coverage for common libraries, while manual instrumentation offers fine-grained control for critical business logic.
Now that you know how to generate trace data, the next logical step is to see it. In our next lesson, you will set up a local Jaeger instance to ingest, visualize, and analyze the traces from an instrumented application.