In our previous lesson, we delved into the application code, instrumenting it with the OpenTelemetry SDK to generate traces, spans, and attributes. You learned how to create the raw data that describes a request's journey. Now, we'll answer the question: where does that data go, and how do we make sense of it?
This lesson completes the tracing loop. You will learn to set up Jaeger, a powerful open-source tool for distributed tracing, on your local machine. We will configure an application to send its trace data to Jaeger, and then spend the bulk of our time learning how to navigate the Jaeger UI to visualize, search, and analyze these traces. Mastering this tool is fundamental for diagnosing performance bottlenecks and errors in complex distributed systems—a critical skill for anyone operating services at scale.
The Role of a Tracing Backend
The OpenTelemetry SDK in your application generates and exports trace data. But it doesn't store or visualize it. For that, you need a tracing backend. Jaeger is one of the most popular open-source backends, originally built at Uber to manage their vast microservices architecture.
A tracing backend is responsible for:
- Ingesting trace data from many different services.
- Storing that data in a durable database.
- Providing a query engine and a user interface to search and analyze the traces.
While we will use a simple "all-in-one" Jaeger setup for local development, it's useful to understand the components of a production-grade deployment, which will resonate with your system design interests.
A Practical Guide to Distributed Tracing with Jaeger
This article provides an excellent overview of Jaeger's architecture before diving into a hands-on lab. Understanding these components helps in appreciating how the system works at scale.
Please read the section titled "Part 3: The Architecture - A Look Under Jaeger's Hood". Focus on understanding the roles of the Agent, Collector, Storage Backend, and Query/UI services. Note the distinction between the in-memory storage we'll use and the persistent options like Elasticsearch or Cassandra used in production.
Step 1: Running Jaeger Locally with Docker
The easiest way to get started is by using the official jaegertracing/all-in-one Docker image. This image bundles all the Jaeger components into a single process with an in-memory database, perfect for local development and experimentation.
A Practical Guide to Distributed Tracing with Jaeger
This section of the guide provides the exact command to get a Jaeger instance up and running.
Find the subsection "Step 1: Running Jaeger with Docker" and execute the docker run command provided. This command will start the Jaeger container and map the necessary ports. Once it's running, you should be able to access the Jaeger UI by navigating to http://localhost:16686.
The command exposes several ports. Here are the most important ones for our purposes:
16686:16686: The port for the Jaeger web UI.14268:14268: The port for the collector to receive traces over HTTP (which we'll use from our application).6831:6831/udp: The port for the agent to receive traces over UDP.
A Note on Production Architectures:
While the all-in-one image is convenient, a more robust and scalable architecture involves using the OpenTelemetry Collector. The Collector is a separate service that sits between your applications and your backend (Jaeger). It receives telemetry data, processes it (e.g., filtering, batching, adding attributes), and then exports it to one or more backends. This decouples your application from the specifics of the backend and provides a flexible layer for data management. The Docker documentation on OpenTelemetry provides a good example of this setup.
Instrumenting a JavaScript App with OpenTelemetry
This document from Docker shows a docker-compose.yaml file that includes an application, an OpenTelemetry Collector, and Jaeger. It's a great reference for a more production-like setup.
Skim through the collector-config.yaml file to see how it's configured to receive OTLP data and export it to Jaeger. Then look at the docker-compose.yaml to understand how the three services (app, collector, jaeger) are wired together. This is a common pattern you would see in production environments.
Step 2: Sending Traces to Jaeger
In the previous lesson, we configured an Exporter as part of the OpenTelemetry SDK setup. To send traces to our new Jaeger instance, we simply need to ensure our exporter is pointing to the correct endpoint.
If you are using the OTLP (OpenTelemetry Protocol) exporter, you would typically set its endpoint to the Jaeger Collector's OTLP endpoint. In our simple all-in-one setup, this is http://localhost:14268/api/traces for the Go Jaeger exporter or a different port for the OTLP exporter. The video below demonstrates adding Jaeger to a docker-compose file and configuring the application's environment variables to point to it.
How To Implement Distributed Tracing for Microservices With Jaeger
This video shows the practical steps of integrating Jaeger into an existing microservices project using Docker Compose.
Watch the segment from adding Jaeger. Notice how the Jaeger service is added to the docker-compose.yaml file and how the applications are configured with an environment variable (OTEL_EXPORTER_OTLP_ENDPOINT) to send their telemetry data to the Jaeger instance.
After configuring your application's exporter and running both the application and Jaeger, you can generate some trace data by sending requests to your application's endpoints (e.g., using curl or a web browser).
Step 3: Visualizing and Analyzing Traces in the Jaeger UI
With traces flowing from your application to Jaeger, you can now use the UI to turn that raw data into actionable insights. This is where the value of distributed tracing becomes apparent.
Open the Jaeger UI at http://localhost:16686.
The Search Interface
The main page is the search interface. On the left panel, you can:
- Select the Service you want to investigate.
- Filter by a specific Operation (the name of the root span).
- Search by Tags (attributes). This is extremely powerful. You can find all traces for a specific user ID (
user.id=123), all failed requests (error=true), or requests to a specific HTTP route (http.target=/api/v1/users). - Filter by Duration to find unusually slow or fast requests.
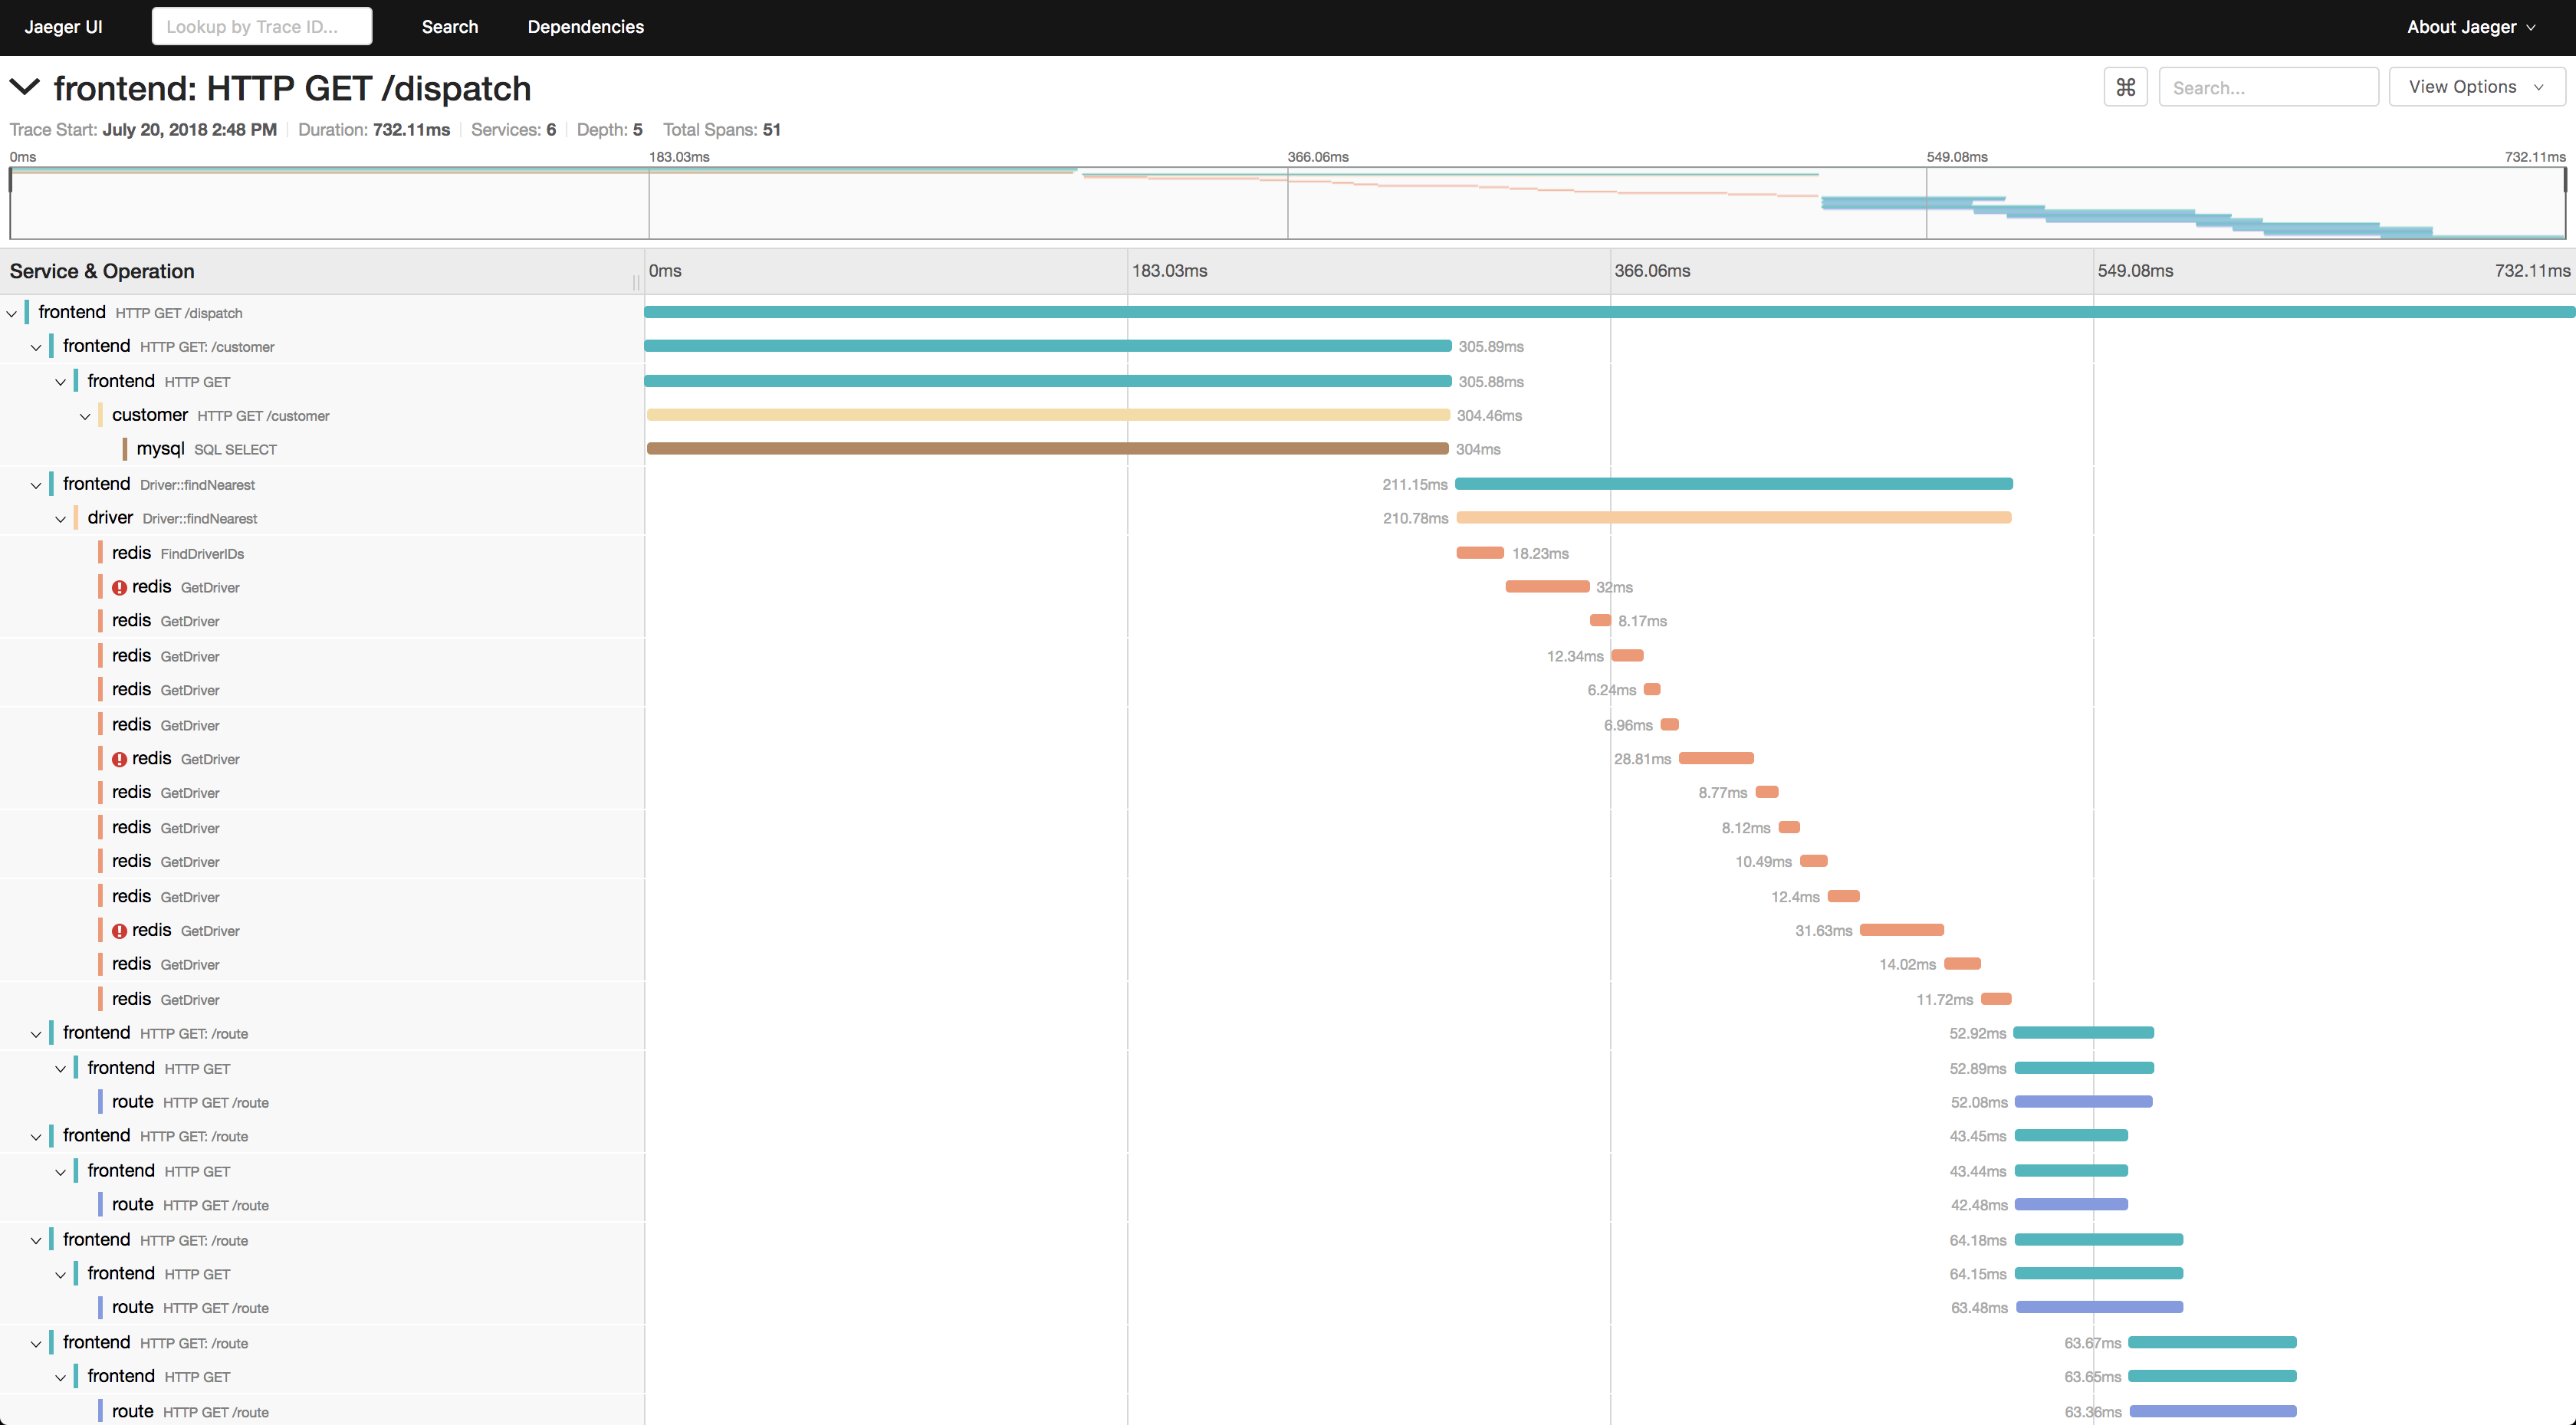
Analyzing the Trace View
After finding and clicking on a trace, you are presented with the trace detail view. This view is packed with information. The following video provides an excellent walkthrough of how to interpret this screen.
Distributed Tracing Explained: OpenTelemetry & Jaeger Tutorial
This video offers a clear, narrated tour of the Jaeger UI, explaining how to interpret the different parts of the trace view to understand what your application is doing.
Watch the detailed walkthrough from this segment. Pay close attention to how the presenter: Navigates from the search screen to a specific trace. Interprets the waterfall view to understand the sequence and duration of operations. Identifies parent-child relationships between spans. Clicks on a specific span to inspect its tags (attributes), which contain rich metadata about the operation.
Practical Diagnosis Scenarios
Let's apply this to common debugging scenarios you'll face.
1. Investigating High Latency
A user reports that "the checkout process is slow."
- In the Jaeger UI, select your
checkout-service. - Set the
Min Durationfilter to find slow traces (e.g.,>2s). - Click "Find Traces" and open one of the results.
- Examine the waterfall diagram. The longest horizontal bars are your primary suspects. Is it a database query? A call to a downstream payment service? The visual layout makes the bottleneck immediately obvious.
- Click on the longest span. Inspect its tags and events. A database span might have the exact SQL query in its tags. A downstream service call will have HTTP-related tags.
2. Investigating Errors
A dashboard alert fires for an increase in HTTP 500 errors.
- In the Jaeger UI, select the relevant service.
- In the "Tags" field, enter
error=true. This is a standard tag added by OpenTelemetry instrumentation when an error occurs. - Click "Find Traces". You will now see a list of all requests that failed.
- Open a trace. The span that failed will typically be highlighted in red.
- Click on the red span and inspect its logs/events. You'll often find the full exception message and stack trace, telling you exactly where and why the error occurred.
The ability to move from a high-level symptom ("it's slow") to a specific, contextualized root cause (a slow query in the inventory-service) within seconds is the superpower that distributed tracing provides.
Conclusion
In this lesson, you have completed the observability loop for distributed tracing. You've gone from generating trace data to collecting, storing, and analyzing it with a powerful tool.
Key takeaways from this session include:
- Jaeger is a tracing backend that ingests, stores, and visualizes trace data sent from instrumented applications.
- The
jaegertracing/all-in-oneDocker image provides a convenient way to run Jaeger locally for development. - A more robust architecture uses the OpenTelemetry Collector as an intermediary to process and forward telemetry data.
- The Jaeger UI allows you to search for traces using services, operations, and tags, and to analyze request flows using the waterfall diagram.
- By inspecting individual spans, you can access detailed attributes and events that are crucial for diagnosing latency and errors.
You are now equipped with the foundational skills for tracing in a distributed environment. However, traces only tell part of the story. In our next lesson, we will explore another essential pillar of observability: centralized logging. You will learn how to design a system to aggregate high-volume log data from all your services, allowing you to correlate log events with the traces you've just learned to analyze.