Welcome to our next lesson on observability. In our previous session, we focused on distributed tracing with Jaeger, learning how to follow a single request's journey through a complex system. Tracing helps us pinpoint where latency or an error occurs. Now, we will explore centralized logging, which tells us what the problem is—the specific error message, the context, and the state of the application at that moment.
This lesson addresses a cornerstone of operating large-scale systems: aggregating and analyzing high-volume log data. As a software engineer with extensive experience, you understand the importance of logs for debugging. Here, we'll elevate that understanding to an architectural level. We will design a complete, scalable, and fault-tolerant centralized logging solution, a frequent topic in system design interviews for principal-level roles. We will use the popular ELK Stack as our primary example, but we'll focus on the underlying principles that apply to any such system.
The Challenge of Distributed Logs
In a microservices architecture, an application might consist of dozens or even hundreds of services, each running on multiple instances. When an issue arises, the relevant log entries could be scattered across numerous servers, in different formats, and with unsynchronized timestamps. Manually accessing and correlating these logs is impractical, especially during a high-pressure incident.
The video below eloquently describes this problem and introduces the solution we'll be designing.
Distributed Logging System Design with Ex-Amazon SDE
The presenter from Interview Simplified does an excellent job of setting the stage, explaining the pain points of decentralized logging and the high-level purpose of a centralized system.
Watch the introduction from the beginning until the design begins. This will frame the problem we are solving today.
Defining the System: Requirements
Before drawing any architecture diagrams, a principal engineer must first clarify the system's requirements. This step ensures the design is fit for purpose and addresses the core needs of its users (primarily developers and SREs).
We can categorize these requirements into two groups:
- Functional Requirements: What the system must do.
- Non-Functional Requirements: The qualities the system must possess, such as scalability and reliability.
The following article provides a clear and concise breakdown of these requirements for a large-scale logging system.
Designing a Scalable Centralized Logging System
This section of the article by Rahul Garg lays out the functional and non-functional requirements in a structured way that is perfect for a system design context.
Please read the section Functional Requirements and then continue to read the Non-Functional Requirements that follow. Pay close attention to the scale mentioned (1 million req/sec) and the latency targets, as these drive many of the architectural decisions we'll make.
High-Level Architecture: The Journey of a Log
A robust logging pipeline can be understood as a multi-stage data flow. Let's trace the journey of a single log event from its creation to its analysis. This journey typically involves five stages: Collection, Buffering, Processing, Storage, and Visualization.
A very common and powerful implementation of this pattern is the ELK Stack, which stands for Elasticsearch, Logstash, and Kibana.

Let's break down these components in the context of our data flow:
-
Log Collection (The Agent): Logs are generated by applications and written to local files. A lightweight agent, called a shipper, runs on each server. Its job is to tail these log files and forward them to a central location. In the ELK world, this agent is often Filebeat. These agents are designed to be asynchronous and have a minimal performance footprint on the application servers.
-
Buffering (The Message Queue): The agents don't send logs directly to the processing or storage layer. Instead, they send them to a durable buffer, most commonly Apache Kafka. This is a critical design choice for decoupling. Kafka acts as a shock absorber, smoothing out bursts of log traffic (which often happen during incidents) and preventing the log shippers from being blocked. It also provides durability, ensuring logs aren't lost if the downstream processing components are temporarily unavailable.
-
Processing (The Processor): Raw log lines from various services are often unstructured and inconsistent. The processing layer is responsible for parsing these raw strings into structured data (usually JSON), enriching them with additional metadata (like GeoIP lookups), filtering out noise (e.g., dropping verbose debug logs from production), and routing them to the correct destination. In the ELK stack, this role is filled by Logstash. For extremely high-throughput systems, stream-processing engines like Apache Flink are also used.
-
Storage & Indexing (The Search Engine): The processed, structured logs are sent to a specialized database optimized for search and analysis. Elasticsearch is the engine at the heart of the ELK stack. It's not just a database; it's a distributed search engine built on Apache Lucene. It takes the structured JSON logs and builds an inverted index, which allows for incredibly fast full-text search and complex queries.
-
Query & Visualization (The UI): Finally, engineers need a user interface to interact with the logs. Kibana is the web UI for Elasticsearch. It provides a powerful interface for searching logs, creating visualizations (graphs, charts, maps), and assembling them into dashboards for monitoring and analysis.
The following video provides a fantastic walkthrough of this entire architecture, cementing the role of each component.
Distributed Logging System Design with Ex-Amazon SDE
This video walks through a complete end-to-end design, using Kafka and Flink, which are highly relevant to your goal of understanding high-scale data systems.
Watch the following segments to see how these components fit together: First, watch the section on collection and buffering, which covers agents and Kafka. Next, see how processing is handled in the section on Apache Flink. Then, understand the storage layer options from storage backends. Finally, see how users interact with the data in the segment on querying and dashboards.
Deep Dive: Elasticsearch Architecture
To truly appreciate why the ELK stack is so powerful, we need to look closer at its core component: Elasticsearch. Its ability to provide near real-time search across terabytes of data is a result of its distributed architecture. Understanding concepts like shards and replicas is fundamental to designing for scale and resilience.
An Elasticsearch cluster is composed of one or more nodes (servers). An index (like a database in a traditional RDBMS) is split into multiple shards. Each shard is a self-contained Lucene index. Elasticsearch distributes these shards across the nodes in the cluster.
To achieve high availability, each shard can have one or more replicas. The main shard is called the primary shard, and it handles write operations. The replicas automatically copy data from the primary and can handle read (search) requests. If the node holding a primary shard fails, a replica is automatically promoted to become the new primary, ensuring no data is lost and the system remains available.
This video gives an excellent visual explanation of these concepts.
Elasticsearch Architecture and Design Considerations
This video from Vincent Stevenson provides a clear, concise explanation of the core architectural concepts of Elasticsearch that enable its speed and resilience.
Watch these key parts: Inverted Indices: Understand the data structure that makes Elasticsearch search so fast. Cluster, Shards, and Replicas: See how data is distributed for scale and fault tolerance. Write/Read/Failover Process: This walkthrough clarifies how primary and replica shards work together to handle writes, reads, and node failures.
A Complete Architecture: Hot and Cold Storage
Storing all logs in Elasticsearch can be expensive, especially when retaining data for long periods (e.g., for compliance). A common pattern in large-scale systems is to use a tiered storage strategy:
- Hot Storage: Recent, frequently accessed logs (e.g., the last 30 days) are kept in Elasticsearch for fast, interactive querying.
- Cold Storage: Older, infrequently accessed logs are archived to a much cheaper object store like Amazon S3 or Google Cloud Storage.
This approach optimizes costs while still allowing access to historical data when needed, for example, through tools like Amazon Athena which can query data directly in S3.
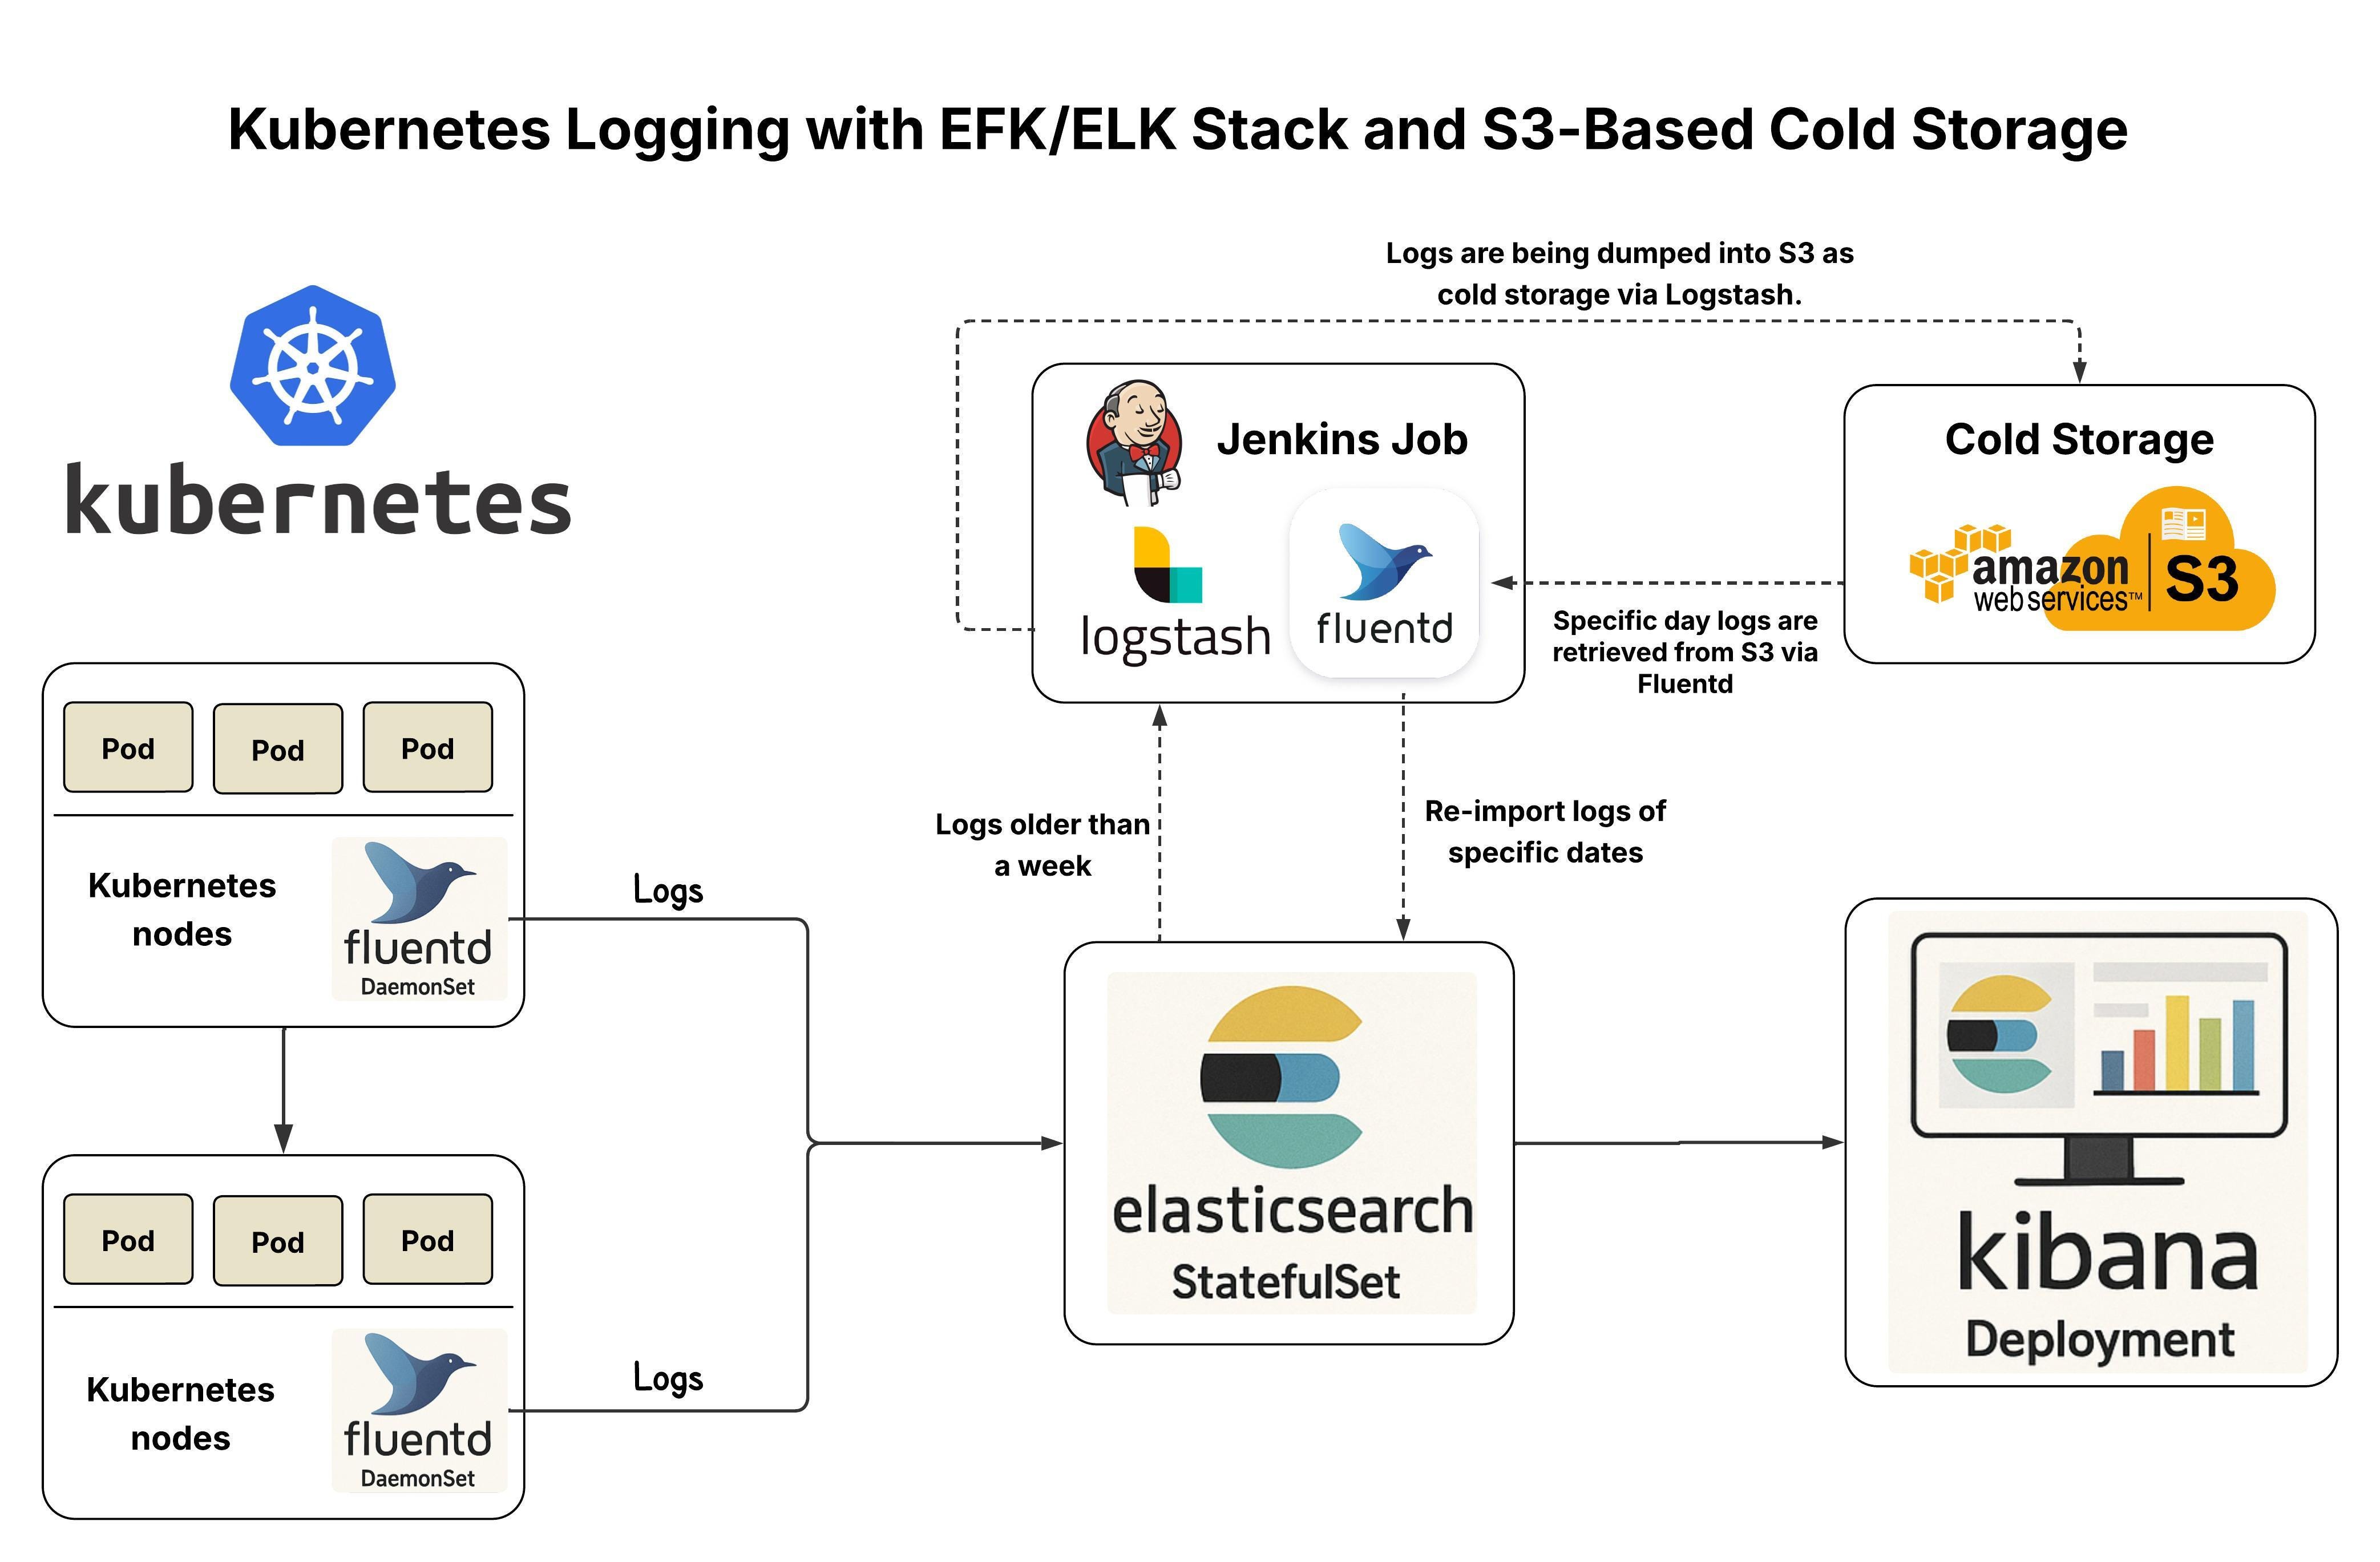
This multi-tiered approach demonstrates a key trade-off that senior engineers must constantly evaluate: performance vs. cost.
Conclusion
In this lesson, we designed a complete, scalable, and resilient centralized logging system. You have moved beyond simply using logs to architecting the entire pipeline that makes them available and searchable at scale.
Here are the key takeaways:
- Centralized logging is a critical pillar of observability, providing the "what" and "why" during incident analysis.
- A robust logging architecture follows a five-stage flow: Collection, Buffering, Processing, Storage, and Visualization.
- The ELK stack (Elasticsearch, Logstash, Kibana), often augmented with Kafka as a buffer, is a standard and powerful implementation of this architecture.
- Decoupling components with a message queue like Kafka is essential for handling traffic bursts and improving system resilience.
- Elasticsearch's distributed nature, using shards and replicas, provides both scalability for search queries and high availability against node failures.
- Balancing performance and cost through hot and cold storage tiers is a crucial consideration for large-scale, long-term log retention.
You now have a solid understanding of both distributed tracing and centralized logging. In our next lesson, we will complete the observability trifecta by exploring monitoring and alerting. We will learn how to define Service Level Indicators (SLIs) and Objectives (SLOs) to quantitatively measure the health of your services and configure systems to proactively notify you when those objectives are at risk.