Introduction
In our previous lesson, we established your first respiratory baseline using the Stange test, a maximal hold on a full inhalation. This gave us a quantitative look at your body's response to developing hypoxia and hypercapnia, starting from a point of maximum oxygen reserve. Today, we will explore the physiological inverse: the Genchi test, which involves a maximum breath hold on a full exhalation.
This lesson will guide you through performing the Genchi test and interpreting your results using data from clinical studies. This test provides a different, and in many ways more challenging, assessment of your respiratory control. While the Stange test gives an insight into your O2 storage and overall gas exchange efficiency, the Genchi test places a much stronger emphasis on your physiological and psychological tolerance to carbon dioxide. Mastering both gives us a more complete picture of your respiratory baseline, which is essential for your goal of designing personalized breathwork protocols.
The Physiology of an Expiratory Hold
When you perform a Genchi test, you are holding your breath after a complete exhalation. This starting point is fundamentally different from the Stange test, and the physiological consequences are profound. Let's visualize this difference.
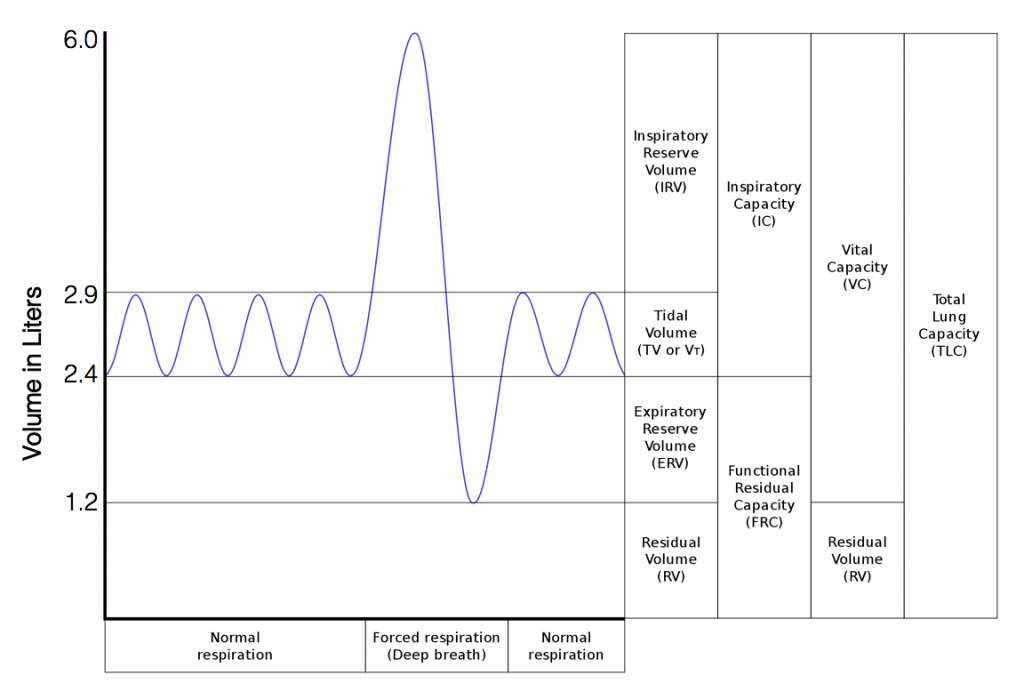
As you can see from the spirogram, at the start of a Genchi hold, your lungs contain only the Residual Volume (RV)—the small amount of air that cannot be voluntarily exhaled. This has two major implications:
- Diminished Oxygen Reserve: You begin the hold with a minimal amount of oxygen in your lungs. As your body's metabolism continues to consume , the partial pressure of oxygen in your blood (Pa) drops much more rapidly than during an inspiratory hold, leading to a faster onset of hypoxia.
- Potent CO₂ Stimulus: Simultaneously, metabolic activity produces carbon dioxide (), causing Pa to rise. With very little air in the lungs to dilute it, the concentration of at the alveolar level increases quickly. This provides a strong and immediate signal to your brain's respiratory centers, creating a powerful urge to breathe.
Because of this dual challenge—rapidly falling and quickly rising —the break point of a Genchi hold is reached much sooner. The test is therefore considered a more direct measure of your chemosensitivity to carbon dioxide and your psychological ability to tolerate the associated discomfort. Interestingly, this type of apnea is also known to trigger a more pronounced splenic contraction, an autonomic response that releases a reserve of red blood cells into circulation to enhance oxygen-carrying capacity.
How to Perform the Genchi Test
A consistent methodology is crucial for obtaining a reliable baseline. We will use a protocol synthesized from the research literature. First, let's review the procedure as described in a study on the fitness of university students.
[PDF] PECULIARITIES OF FUNCTIONAL AND MOTOR FITNESS OF 1ST ...
This paper provides a clear, concise protocol for the Genchi test, along with a set of normative values for interpretation.
Please read the section describing the Genchi test (here). Focus on the instructions for the exhalation and the breath-hold itself.
Based on that description and best practices, here is a step-by-step protocol for you to follow:
- Preparation: Sit comfortably in an upright chair. Rest for at least 2 minutes, breathing normally to establish a calm baseline. Have your stopwatch ready.
- Breathing Cycles: Take 2-3 normal, relaxed breaths.
- Exhalation: After a normal inhalation, perform a full and complete exhalation. The exhalation should be thorough but not forcefully strained to the point of discomfort.
- Hold: At the end of the exhalation, close your mouth, pinch your nose, and start the stopwatch. Consciously relax your shoulders, neck, and abdomen.
- End Point: Stop the timer at the very first involuntary contraction of your breathing muscles (you may feel this as a spasm or "hiccup" in your abdomen or throat) or when the urge to breathe becomes definitive and compelling. As with the Stange test, consistency is more important than achieving a maximum possible time.
- Recovery and Repetition: Record your time. Breathe normally for at least 2 minutes to allow your blood gases to fully normalize.
- Calculate the Mean: Repeat the test two more times for a total of three trials. Calculate the arithmetic mean of your three hold times. This average is your Genchi test score.
Interpreting Your Results: Examining the Evidence
Your score from the Genchi test is a valuable data point, and we can contextualize it using published research. Since you are well-versed in analyzing clinical trial data, we'll examine two papers with different populations and slightly different normative scales.
First, let's return to the paper by Chernenko et al. that you just reviewed for the protocol. It not only describes the test but also provides results from a cohort of 143 male university students.
[PDF] PECULIARITIES OF FUNCTIONAL AND MOTOR FITNESS OF 1ST ...
This study provides both normative values and raw data for the Genchi test in a population of healthy young men.
Re-read the Genchi test section (here) to review the normative values they use. Now, examine Table 1 (here). Find the row for the Genchi test (s) and look at the mean scores (X) and standard deviations (s) for the students in each year of study.
The normative values from this paper provide a straightforward scale:
- Excellent: > 50 s
- Good: 35 - 50 s
- Satisfactory: 20 - 35 s
- Bad (Unsatisfactory): < 20 s
Notice in Table 1 that the mean scores for the student groups hover around the high end of "satisfactory" and the low end of "good" (e.g., s for 1st-year students). This gives you a sense of where a typical, healthy young adult population performs.
Next, let's analyze data from a different study that assessed female students participating in various sports. This will add another dimension to our interpretation.
[PDF] Discriminant analysis: peculiarities of impact of sports specialization ...
This paper offers another protocol, slightly different normative values, and pre/post data for female athletes, allowing for between-group analysis.
First, read the description of the Genci test (here). Note the normative criteria provided. Next, examine Table 1 (here). Focus on the "Genchi test, s" row and compare the pre-test mean scores (M) for the three different groups: Badminton, Aerobics, and Callanetics.
This second paper offers a slightly different, three-tiered interpretive scale:
- Healthy Trained: 40 - 60 s
- Healthy Untrained: 25 - 30 s
- Fatigue: < 20 s
From Table 1 in this study, you can see that the badminton players' pre-test mean was s, placing them in the "healthy trained" category, while the other groups started closer to the "healthy untrained" range. This kind of inter-group variation is precisely the sort of data that can fuel hypotheses about how different physical activities influence respiratory function.
Synthesizing the Data
Your Stange test score is likely significantly higher than your Genchi score—often by a factor of two or more. This is normal and expected due to the vastly different starting oxygen reserves. The Genchi test isolates and magnifies the challenge of CO₂ tolerance.
By synthesizing the two sets of norms, we can create a robust framework:
- < 20 seconds: Indicates very high sensitivity to CO₂.
- 20 - 35 seconds: A typical range for an average, healthy but untrained adult.
- 35 - 50 seconds: A good to very good score, indicating above-average CO₂ tolerance and respiratory control.
- > 50 seconds: An excellent score, usually seen in athletes or dedicated breathwork practitioners.
Perform the test, calculate your mean score, and see where you fall within this framework.
Conclusion
You have now performed and analyzed the Genchi test, the second key component of your baseline respiratory assessment. By measuring a maximal hold on an exhalation, you've gained a direct insight into your CO₂ tolerance—a critical factor in breath control and physiological regulation. This data point, when viewed alongside your Stange score, provides a more nuanced understanding of your respiratory system's current state.
Key Takeaways:
- The Genchi test is a maximal expiratory breath hold that primarily assesses CO₂ tolerance.
- The hold time is typically much shorter than the Stange test due to a minimal starting oxygen reserve.
- Based on research data, scores of 35-50 seconds are considered "good," with scores over 50 seconds being excellent for a healthy adult.
- Analyzing the ratio and absolute values of your Stange and Genchi scores gives a multi-faceted view of your respiratory fitness.
In our next lesson, we will add the third and final piece to our baseline assessment: the Control Pause, also known as the BOLT score. Unlike the maximal-effort Stange and Genchi tests, the Control Pause measures the comfortable duration of a breath hold before the first desire to breathe emerges. This provides a subtle but powerful metric of your functional CO₂ sensitivity, which is the cornerstone of the Buteyko method.