Day 2: Supply, Demand, and the Market "Handshake"
Yesterday’s Bridge:
Yesterday, we established that scarcity forces every actor—from an individual to a nation—to make choices, and the true cost of any choice is the opportunity forgone. Today, we scale up from individual decision-making to see how the choices of millions of buyers and sellers interact in a marketplace, creating a powerful mechanism that determines prices and allocates resources across an entire economy.
The Core Concept: The Dance of Supply and Demand
A market is any place or system where buyers and sellers meet to exchange goods and services. The interaction between these two groups is one of the most powerful forces in economics. We can model this interaction using two core concepts: Supply and Demand.
1. Demand: This represents the buyers' side of the market. The Law of Demand states that, all else being equal, as the price of a good falls, the quantity that consumers are willing and able to buy increases.
- Why? For two main reasons:
- The Substitution Effect: When the price of a good falls, it becomes cheaper relative to other goods, so consumers substitute it for more expensive alternatives.
- The Income Effect: A lower price increases the purchasing power of a consumer's income, allowing them to buy more.
- The Demand Curve: Because of this inverse relationship, the demand curve slopes downwards.
2. Supply: This represents the sellers' side. The Law of Supply states that, all else being equal, as the price of a good rises, the quantity that producers are willing and able to sell increases.
- Why? Higher prices generally mean higher potential profits, creating an incentive for firms to produce more.
- The Supply Curve: This direct relationship means the supply curve slopes upwards.
3. Market Equilibrium:
When we put the supply and demand curves on the same graph, they intersect at a single point. This point is called market equilibrium.
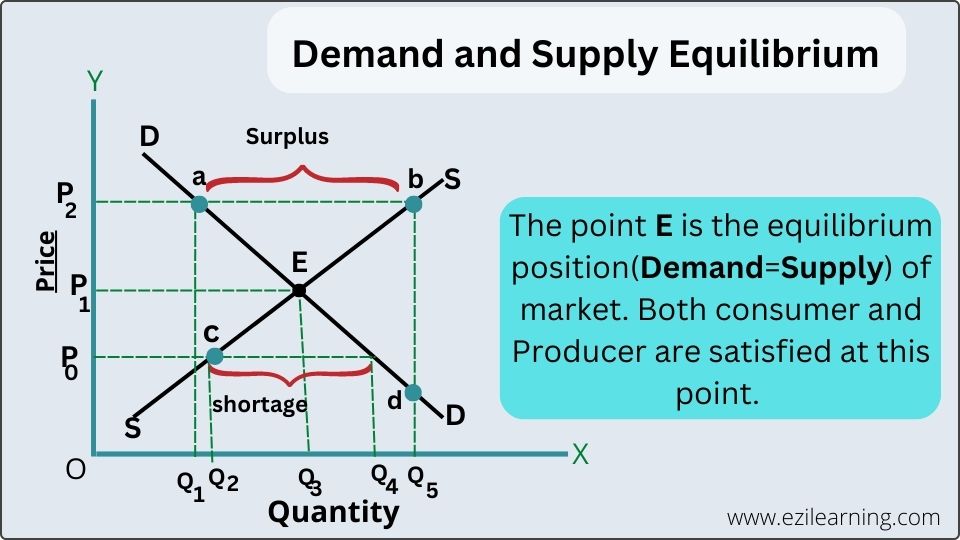
At the equilibrium price, the quantity of a good that buyers want to buy is exactly equal to the quantity that sellers want to sell. This is the "market-clearing" price because there is neither a surplus of unsold goods nor a shortage of goods that buyers can't find. It's the point of balance, a "handshake" between buyers and producers.
- Shortage (Excess Demand): If the price is below equilibrium, more people will want to buy the good than producers are willing to sell. This leads to empty shelves and upward pressure on the price as buyers compete for the limited supply.
- Surplus (Excess Supply): If the price is above equilibrium, producers will supply more of the good than consumers are willing to buy. This leads to warehouses full of unsold goods and downward pressure on the price as sellers try to offload their inventory.
In a free market, these pressures of surplus and shortage constantly push the price back toward equilibrium.
To see this dynamic in action, please watch the following segment from Crash Course Economics.
Supply and Demand: Crash Course Economics #4
This video provides a clear and engaging explanation of the laws of supply and demand and how they interact to create market equilibrium.
Please watch from 03:05 to 04:37. This segment first introduces the demand and supply curves and then shows how their interaction determines the equilibrium price, creating either a surplus or a shortage if the price deviates.
Illustrative Example: The Geopolitics of Oil Prices
Nowhere is the global dance of supply and demand more visible and more critical to geopolitics than in the market for crude oil. The price of oil is not set by a single entity; it emerges from the daily interactions of global supply and global demand.
-
Global Demand is driven by: Economic growth. When major economies like China and the U.S. are expanding, their industries and consumers demand more energy, shifting the demand curve to the right and putting upward pressure on oil prices. During a global recession, demand falls, shifting the curve left and causing prices to drop.
-
Global Supply is driven by: Production decisions and geopolitical events.
- Cartels: The Organization of the Petroleum Exporting Countries (OPEC) can collectively decide to cut production to drive up prices (shifting the supply curve to the left).
- Technology: New extraction technologies, like fracking in the U.S., can dramatically increase supply (shifting the supply curve to the right).
- Conflict: Political instability or war in a major oil-producing region (e.g., the Middle East, Russia) can disrupt production or transport, suddenly reducing supply and causing prices to spike.
The "So What?" Factor:
A sudden shock to oil supply, perhaps from a conflict blocking a key shipping lane like the Strait of Hormuz, has immediate and far-reaching consequences.
- Economic Shock: Higher energy prices act like a tax on the global economy, increasing costs for transportation and manufacturing, which can lead to inflation and slow economic growth.
- Strategic Vulnerability: Countries heavily dependent on imported oil become vulnerable to the political instability of their suppliers. This drives foreign policy decisions, such as forming alliances with oil-producing states or investing in alternative energy sources to reduce dependence.
- Power Shifts: High oil prices transfer immense wealth from consuming nations to producing nations, altering the global balance of economic and political power.
The chart below shows West Texas Intermediate (WTI) crude oil prices over the last decade, with major geopolitical events marked. Notice how events in Libya, Iraq, and Ukraine are correlated with significant price volatility.

Anchor Resource
For a more formal and detailed exploration of market equilibrium, the CORE Econ textbook provides an excellent a-synchronous resource. It uses the accessible example of a market for second-hand textbooks to walk through how a market-clearing price is reached.
8. Supply and demand: Price-taking and competitive markets
The textbook 'The Economy' by the CORE Econ team offers a rigorous look at how markets reach equilibrium. This section will solidify your understanding of the forces that establish a market-clearing price.
Please read section 8.2, 'The market and the equilibrium price'. Focus on how the economist Alfred Marshall reasoned that prices would naturally tend to move towards the equilibrium level where supply equals demand.
Daily Challenge
Think of the COVID-19 pandemic. For each of the following goods, decide whether the primary initial shock was to supply or demand, and predict the initial impact on price.
- Face masks
- Airline tickets
- Lumber for home renovations
Show Analysis
- Face masks: The primary shock was a massive increase in demand. This shifted the demand curve far to the right. The result was an immediate shortage and a sharp increase in price.
- Airline tickets: The primary shock was a catastrophic collapse in demand due to travel restrictions and fear of flying. The demand curve shifted far to the left, creating a massive surplus of empty seats and causing prices to decrease dramatically.
- Lumber: The shock here was twofold, but a major factor was on the supply side. Mill shutdowns and logistics problems reduced the available supply. At the same time, demand increased as people stuck at home started DIY projects. The combination of reduced supply and increased demand led to a severe shortage and a historic price spike.
Next Day Preview
Today we saw how a free market finds its equilibrium price. But what happens when a government decides that price is "too high" for consumers or "too low" for producers? Tomorrow, we will analyze the effects of government interventions like price controls and taxes, and explore their often unintended consequences on market outcomes.