Hello! In our last lesson, we covered the critical first step in memory diagnostics: identifying the common causes of memory leaks and generating a heap dump. You learned how to capture a snapshot of your application's memory using tools like VisualVM and jcmd, and how to configure the JVM to do this automatically when an OutOfMemoryError occurs.
Now that you have the evidence—the .hprof file—it's time for the detective work. This lesson focuses on loading that heap dump into a profiling tool and performing the initial analysis to answer the question: "What is using all the memory?" Mastering this skill is essential for troubleshooting performance issues and is a hallmark of a senior developer, making it a key area to be prepared for in technical interviews.
Loading a Heap Dump for Analysis
A heap dump is a binary file that requires a specialized tool to parse and present in a human-readable format. While there are several tools available, we'll focus on VisualVM, which you're already familiar with, as it's excellent for initial analysis. We will also touch upon Eclipse Memory Analyzer (MAT), a more powerful tool often favored for deep, complex investigations.
To begin, you simply open your profiling tool and load the .hprof file you generated previously. In VisualVM, this is done via the File > Load... menu.
Once loaded, VisualVM presents a Summary view. While this contains useful environmental information, our investigation starts by navigating to the Classes view.
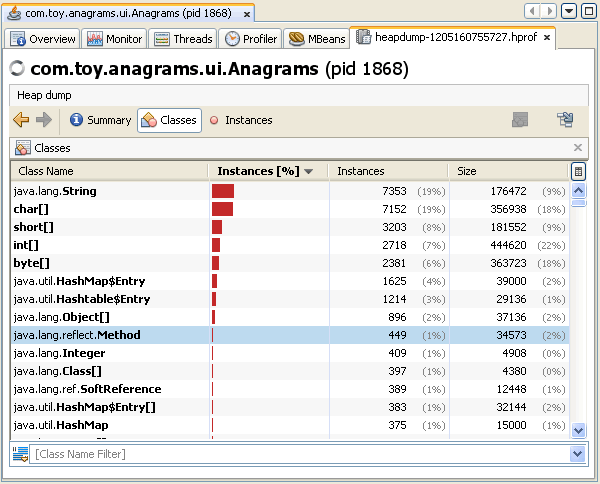
This view is your first stop. It lists every class present in the heap, along with the number of live instances and the total memory they occupy. You can sort this table by either the "Instances" or "Size" column. A potential memory leak often reveals itself here through:
- An unusually high number of instances for a specific class.
- A class consuming a disproportionately large amount of memory.
The Baeldung article "Tool to Analyze Offline Java Heap Dumps" provides a concise overview of this initial step.
Tool to Analyze Offline Java Heap Dumps
This article explains how to open a heap dump in VisualVM and what the initial summary screen shows.
Please read the section titled Analyzing the Heap Dump with VisualVM. Focus on the description of the "Classes by Number of Instances" and "Classes by Size of Instances" sections, as this is the starting point of our analysis.
The Critical Distinction: Shallow vs. Retained Heap
Looking at the total "Size" column is a good start, but to find the true source of a memory leak, you must understand the difference between Shallow Heap and Retained Heap. This is a fundamental concept in memory analysis and a frequent topic in interviews.
-
Shallow Heap: The memory consumed by the object itself. This includes the space for its primitive fields and the references to other objects. For example, the shallow size of an
ArrayListobject is relatively small, as it only contains a few fields like a reference to an internal array and an integer for its size. -
Retained Heap: The total memory that would be freed if this specific object were garbage collected. This includes the object's shallow heap plus the memory of all other objects that are only reachable through it (i.e., objects it "keeps alive"). An
ArrayListcontaining millions of large objects will have a small shallow heap but a massive retained heap.
Finding the objects with the largest retained heap is the key to identifying the source of a memory leak.
The yCrash YouTube channel offers an exceptionally clear explanation of this concept using diagrams.
Fixing OutOfMemoryError: The Ultimate Guide with Heap Dumps & Eclipse MAT
This video provides a clear, visual explanation of the difference between shallow and retained heap, which is crucial for effective memory analysis.
Watch the segment from this timestamp, where the presenter uses diagrams to explain what shallow heap and retained heap mean and how an object's retained size changes based on the references it holds.
Identifying Top Consumers with a Dominator Tree
Tools like Eclipse MAT take the concept of retained heap a step further by organizing the heap dump into a dominator tree. An object A is said to "dominate" an object B if every path from a GC Root to B must pass through A.
This structure is incredibly powerful. The objects at the top of the dominator tree are the primary "choke points" holding onto the largest blocks of memory. By sorting the dominator tree by retained heap size, you can immediately see the biggest culprits.
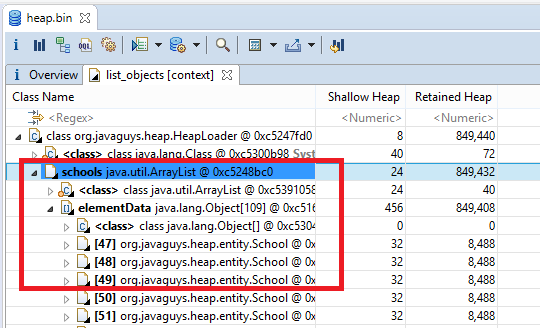
The yCrash video we just looked at also demonstrates how to use the dominator tree view in Eclipse MAT to find these top consumers.
Fixing OutOfMemoryError: The Ultimate Guide with Heap Dumps & Eclipse MAT
This segment shows the practical application of the concepts we've discussed by using the dominator tree in Eclipse MAT.
Now, watch the section from this timestamp. Observe how the presenter sorts the objects by their retained size to quickly identify the Hashmap that is consuming nearly 96% of the heap. This demonstrates the power of analyzing retained heap size.
A Practical Technique: Comparing Two Heap Dumps
For slow, creeping memory leaks, a single heap dump might not be revealing enough. A highly effective technique is to compare two heap dumps taken over a period of time. You take a baseline snapshot, let the application run under load, and then take a second snapshot. By comparing the two, you can pinpoint exactly which objects have grown in number or size.
The following article from Substack provides a perfect, self-contained exercise demonstrating this technique with VisualVM. It presents a simple Java application with a subtle memory leak and walks you through the process of finding it.
Java Exercises: #3 Memory Leaks and VisualVM - Ravil
This article provides a fantastic, step-by-step guide on how to use VisualVM to compare two heap dumps to find the objects that are accumulating over time.
First, briefly review the simple leaky Java application in the "Application" section to understand the context. You don't need to run it yourself; just understand the logic. Then, focus your reading on the section titled Comparing Heap Dumps. Follow the author's process of taking two dumps, using the "compare" feature, and sorting the results to see that the number of User objects has increased significantly. This is a powerful and practical diagnostic method.
This comparison technique directly points you to the objects that are accumulating over time, making them the prime suspects for your memory leak investigation.
Conclusion
In this lesson, you've moved from data collection to active analysis. You now have a systematic approach to dissecting a heap dump to find the objects that are consuming the most memory.
Here are the key takeaways from our investigation:
- The Classes view in a profiling tool is the first place to look for classes with an abnormally high number of instances or total size.
- Understanding the difference between Shallow Heap (an object's own size) and Retained Heap (the memory it keeps alive) is essential. The source of a leak is almost always an object with a large retained heap.
- The Dominator Tree is a powerful representation that helps you quickly identify the top memory consumers by sorting them by their retained heap size.
- Comparing two heap dumps taken over time is a highly effective technique for identifying objects that are steadily accumulating, which is the classic sign of a memory leak.
You've successfully identified what is consuming the memory. The next logical step is to figure out why. In our final lesson for this module, we will learn how to analyze the reference chains of these suspect objects to trace them back to their GC Root, pinpointing the exact part of the code responsible for the leak.