Hello! In our previous lessons, we explored the sophisticated mechanisms of modern garbage collectors like G1 and ZGC, which automate memory management with remarkable efficiency. You've seen how they work to find and reclaim objects that are no longer in use.
This naturally leads to a critical question, one that often surfaces in technical interviews: If garbage collection is automatic, how can a Java application still run out of memory?
Today's lesson addresses this paradox. We will delve into the concept of memory leaks in a garbage-collected language like Java. You will learn what a memory leak is, why it occurs despite the GC's efforts, and explore the common programming mistakes that cause them. Then, we will cover the essential first step in diagnosing these issues: generating a heap dump, which is a snapshot of your application's memory. This is a fundamental skill for any developer or SDET involved in performance analysis and troubleshooting.
What Is a Memory Leak in a Garbage-Collected World?
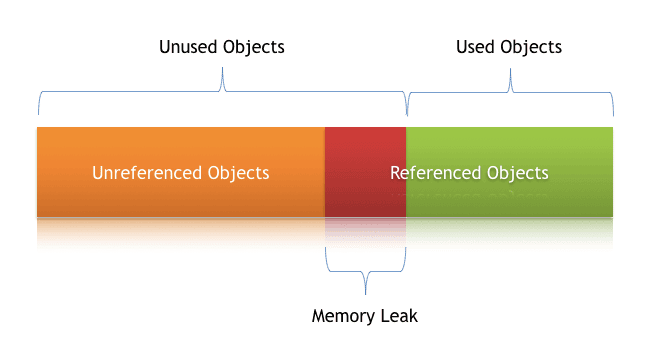
In languages without automatic memory management, like C or C++, a memory leak occurs when a programmer allocates memory and forgets to free it. In Java, the situation is more subtle. The Garbage Collector automatically frees memory occupied by unreachable objects. A memory leak in Java, therefore, occurs when objects are no longer needed by the application but are still reachable from active references. The GC, doing its job correctly, sees these objects as "live" and will not collect them.
This creates a situation where the heap slowly fills with useless objects, leading to increased GC activity, degraded performance, and eventually, a fatal java.lang.OutOfMemoryError.
The Baeldung article "Understanding Memory Leaks in Java" provides a clear definition.
Understanding Memory Leaks in Java
This article offers a great introduction to memory leaks in the context of Java's garbage collection.
Please read the section titled What Is a Memory Leak. Pay close attention to the distinction it makes between referenced and unreferenced objects.
The article includes a diagram that perfectly illustrates this concept. Referenced objects can be split into two groups: those that are actually being used by the application, and those that are unused but still referenced. This second group represents the memory leak.
Common Causes of Memory Leaks in Java
Understanding the common patterns that lead to memory leaks is crucial for both writing robust code and for answering interview questions effectively. Let's explore some of the most frequent culprits.
The "Lazy Programmer" YouTube channel provides a concise overview of these causes and a practical demonstration of the most classic example.
Memory Leaks in Java | Issues Caused and How to Prevent | Example
This video defines memory leaks and walks through a live demonstration of one caused by a static field, using VisualVM to monitor the heap.
Watch the following segments: Definition of a memory leak: This reinforces the concept we just discussed. Common causes: The video lists several key patterns to watch out for. Static member example: This is a step-by-step demonstration showing how a static List grows and is never garbage collected. You've used VisualVM before, so this analysis should be familiar.
As the video demonstrated, some of the most common causes include:
- Growing
staticCollections: When astaticfield references a collection (like aListorMap) and objects are continuously added but never removed, those objects will remain in memory for the entire lifetime of the application. This is a very common source of leaks. - Unclosed Resources: Objects like file streams (
FileInputStream), database connections (Connection), and network sockets hold onto native memory resources. If you fail to close them (ideally in afinallyblock or using atry-with-resourcesstatement), the GC cannot reclaim the associated memory. - Improper
equals()andhashCode()Methods: This is a more subtle but critical cause, especially for interview scenarios. When you use objects as keys in aHashMapor elements in aHashSet, these collections rely onequals()andhashCode()to identify duplicates. If you don't override these methods correctly for your custom classes, you might end up inserting what you believe are duplicate objects, but the collection will treat them as unique, causing it to grow indefinitely. - Non-static Inner Classes: A non-static inner class (or an anonymous class) holds an implicit reference to its enclosing outer class instance. If the inner class object's lifecycle is longer than the outer class's (e.g., it's passed to another long-lived thread), it will prevent the outer class instance—and all the memory it holds—from being garbage collected.
For a more detailed textual explanation of these scenarios, the Baeldung article we looked at earlier is an excellent resource.
Understanding Memory Leaks in Java
This article provides code examples and explanations for the most common types of memory leaks.
Read through Section 3, Types of Memory Leaks in Java. Focus on understanding the examples for static fields, unclosed resources, and improper equals()/hashCode() implementations.
How to Generate a Heap Dump
Now that you can identify potential causes of memory leaks, the next step is learning how to gather evidence. When you suspect a memory leak or face an OutOfMemoryError, your most powerful tool is a heap dump.
A heap dump is a snapshot of the entire Java object heap at a given moment. It's stored in a binary file (usually with a .hprof extension) and contains information about all active objects, their fields, and the references between them. Analyzing this file allows you to see exactly what is consuming memory.
There are several ways to generate a heap dump. We'll cover the most practical ones.
Method 1: Using a GUI Tool (VisualVM)
For applications running in a development environment, this is often the easiest method. You're already familiar with VisualVM. It provides a simple point-and-click interface to generate a heap dump for any local Java process.
- Launch VisualVM (located in your JDK's
bindirectory). - In the "Applications" panel on the left, find and double-click your running Java process.
- Navigate to the "Monitor" tab to observe memory usage. If you suspect a problem, you can take a heap dump.
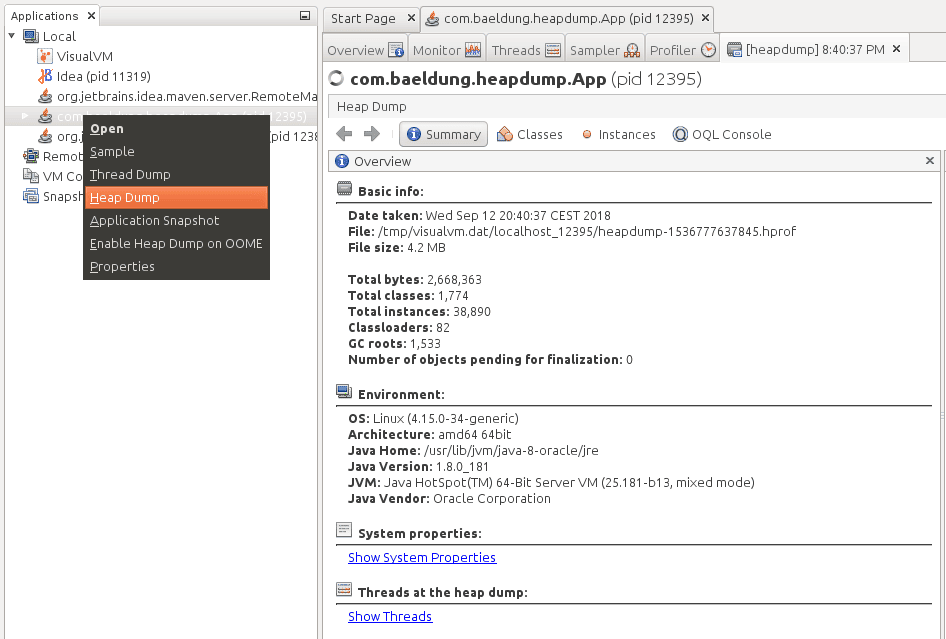
- Right-click the process in the "Applications" panel and select "Heap Dump".
VisualVM will generate the heap dump and open it in a new tab for immediate analysis.
Method 2: Automatic Dump on OutOfMemoryError
This is the most critical method for production environments. You can configure the JVM to automatically generate a heap dump at the exact moment an OutOfMemoryError occurs. This captures the state of the heap when it was completely full, which is invaluable for post-mortem analysis.
You enable this by adding the following JVM flags when you start your application:
-XX:+HeapDumpOnOutOfMemoryError -XX:HeapDumpPath=/path/to/heapdump.hprof
-XX:+HeapDumpOnOutOfMemoryError: Tells the JVM to generate a heap dump when anOutOfMemoryErroris thrown.-XX:HeapDumpPath: Specifies the file path where the dump should be saved. If you only specify a directory, the JVM will create a file with a unique name.
As an SDET, knowing this flag is essential for setting up robust test environments that can automatically capture diagnostic data upon failure.
Method 3: Using Command-Line Tools
For headless servers or automated scripts, command-line tools are the way to go. The JDK provides two main utilities for this. First, you need the Process ID (PID) of your Java application, which you can find using the jps command.
$ jps
12345 MyApplication
67890 Jps
Here, the PID for MyApplication is 12345.
Using jcmd (Recommended)
jcmd is the modern, recommended tool for sending diagnostic commands to the JVM.
jcmd 12345 GC.heap_dump /path/to/heapdump.hprof
Using jmap (Older Tool)
jmap is an older utility but is still widely used.
jmap -dump:format=b,file=/path/to/heapdump.hprof 12345
The article "How to Generate JVM Heap Memory Dump?" from GeeksforGeeks provides a good summary of these different methods.
How to Generate JVM Heap Memory Dump? - GeeksforGeeks
This article is a practical guide that lists and explains various methods for generating a heap dump.
Read the introduction to understand what a heap dump is. Then, review the sections covering Methods 1 through 4. This will reinforce your understanding of generating dumps with jmap, jcmd, VisualVM, and automatically on an OutOfMemoryError.
Conclusion
In this lesson, we have demystified the concept of memory leaks in Java and equipped you with the practical skills to take the first step in diagnosing them. This knowledge moves you beyond simply using the language to understanding how to manage its resources effectively—a key differentiator in senior-level interviews.
Here are the key takeaways:
- A memory leak in Java occurs when objects are no longer in use but are still referenced, preventing the Garbage Collector from reclaiming their memory.
- Common causes include long-lived static collections, unclosed resources, and improper
equals()/hashCode()implementations in hash-based collections. - A heap dump is a snapshot of the application's heap and is the primary tool for analyzing memory consumption.
- You can generate a heap dump using GUI tools like VisualVM, command-line utilities like
jcmdandjmap, or automatically upon anOutOfMemoryErrorusing the-XX:+HeapDumpOnOutOfMemoryErrorJVM flag.
We've learned what a memory leak is and how to capture the evidence. In our next lesson, we will focus on the analysis. We'll load a heap dump into VisualVM and learn how to trace the references to identify the root cause of a memory leak in a sample application.