Welcome to the final lesson in our module on JVM Internals and Memory Management. In our previous session, we did the initial forensic work on a heap dump. You learned how to load it into a profiler, identify the top memory consumers using the dominator tree, and spot accumulating objects by comparing two snapshots. We've identified our main suspects—the objects consuming the most memory.
Now, we'll complete our investigation. This lesson focuses on answering the crucial question: why are these suspect objects not being garbage collected? We will analyze their reference chains to trace them back to their origin, pinpointing the exact root cause of a memory leak. Mastering this final step is what separates a good developer from a great one and is a skill frequently tested in senior engineering interviews.
From Suspect to Root Cause: Understanding GC Roots
In the last lesson, you identified objects with a large retained heap. An object is retained (i.e., not garbage collected) because it is still "reachable." This means there's a chain of references connecting it to a Garbage Collection (GC) Root.
GC Roots are a special set of objects that the JVM knows are always reachable, and therefore, they are the starting points for the "mark" phase of garbage collection. Anything that can be reached by following references from a GC Root is considered "live."
Common examples of GC Roots include:
- Active Threads: The call stack of each running thread is a GC root. Any local variables or parameters on the stack are considered live.
- Static Variables: Variables declared with the
statickeyword belong to the class, not an instance, and live for the entire lifetime of the class. They are a very common source of memory leaks. - JNI References: Objects created or passed to native code (via the Java Native Interface) are held by the JVM.
Our goal is to find the specific reference chain that tethers our suspect object to one of these GC Roots.
Tracing the "Path to GC Roots"
Profiling tools like Eclipse Memory Analyzer (MAT) provide a powerful feature specifically for this task, typically called "Path to GC Roots." Once you've identified a suspicious object (for example, from the Dominator Tree view), you can use this feature to see the exact chain of references keeping it alive.
The article "10 Tips for using the Eclipse Memory Analyzer" provides an excellent, practical example of using this feature to solve a leak.
10 Tips for using the Eclipse Memory Analyzer - EclipseSource
This article provides several practical tips for using MAT. We'll focus on the section that demonstrates how to trace the reference path of a leaking object back to its root.
Please read section 5, Exploring Paths to the GC Roots. The author identifies an unexpected leak even after disposing of a Controller object. Pay close attention to how they use the "Paths To GC Roots" feature on a Listener instance and discover it's being held by a static list in the Controller class. This is a classic memory leak pattern.
As you saw in the reading, the output of this analysis is a tree or list showing the chain of references. It might look something like this:
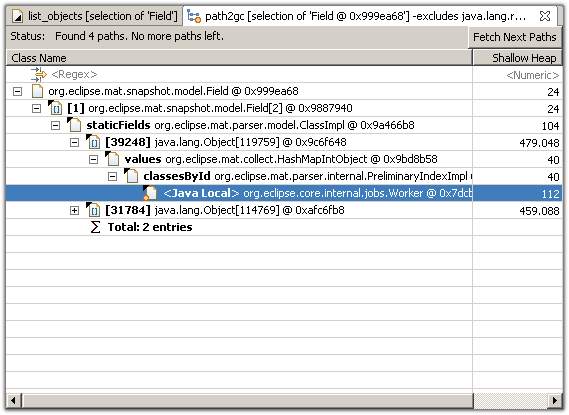
In this example, the org.eclipse.core.internal.jobs.Worker object is being kept alive by a chain of references that originates from a staticFields entry. This immediately tells you that a static variable is involved, giving you a precise area in the code to investigate.
A Practical Walkthrough
Let's watch a couple of short video segments that demonstrate this process in both VisualVM and MAT. While MAT is generally more powerful for this deep analysis, it's useful to see how the concept applies across tools.
First, let's see how the reference path for the Person objects from our sample memory leak application can be found in VisualVM.
Java Memory Management Garbage Collection, JVM Tuning, and Spotting Memory Leaks
This video segment demonstrates loading a heap dump and finding the references to a leaking object.
Watch from this timestamp. The presenter selects a Person object and inspects its references. Observe how the tool shows that the object is held within the elementData array of a java.util.ArrayList, confirming that the list is the direct cause of the objects being retained.
Now, let's see a similar analysis performed in MAT, which is the tool we've been focusing on. This demonstration shows how to navigate the dominator tree to trace the references.
Heap Dump Analysis Using Eclipse MAT
This video demonstrates how to use the Dominator Tree in MAT to drill down into the largest memory consumer and follow its reference chain to find the leaking objects.
Please watch from this timestamp. Notice how the presenter expands the top memory consumer in the Dominator Tree, navigating through the task thread, an array, and finally revealing the vast number of string objects that are causing the leak. This top-down approach from the Dominator Tree is a very effective workflow.
The Complete Diagnostic Workflow
We have now covered the entire process of diagnosing a memory leak, from noticing the initial symptoms to pinpointing the root cause. This systematic workflow is a critical skill for any senior Java developer.
The following flowchart provides a great high-level summary of the steps we've covered in the last few lessons.

Let's trace our journey through this chart:
- Increasing Memory Usage: This is the initial symptom that triggers an investigation.
- Collect GC Logs / Take Heap Dumps: In our first lesson on this topic, you learned how to generate heap dumps using
jcmdand JVM flags. - Analyze with MAT/VisualVM: In the previous lesson, you learned how to load the dump into these tools.
- Find Largest Objects: You used the Dominator Tree to find objects with the largest retained heap.
- Check for Static Collections / Resource Leaks: This is what we've done today. By analyzing the "Path to GC Roots," we can identify if the leak is caused by an unbounded static collection, an unclosed resource, or another pattern.
- Implement Fixes: Once the root cause is known (e.g., a static list that never gets cleared), you can implement a fix, such as adding size limits, eviction policies, or ensuring resources are closed in a
finallyblock. - Monitor Memory: After deploying the fix, you monitor the application to ensure memory usage has stabilized.
By consistently applying this structured approach, you can methodically solve even the most challenging memory issues.
Conclusion
This lesson concludes our deep dive into JVM memory management. You have successfully connected the final dots in a memory leak investigation. You can now not only identify what is consuming memory but also trace the reference chain to understand why it's being retained, leading you directly to the source of the problem in your code.
Here are the key takeaways:
- Objects are kept in memory because they are reachable from a GC Root.
- The "Path to GC Roots" feature in profilers like MAT is the definitive tool for finding the reference chain that prevents an object from being garbage collected.
- Common sources of leaks are long-lived static collections, un-removed listeners, and improperly managed ThreadLocal variables.
- The entire process, from detection to resolution, follows a systematic workflow of capturing data, analyzing, identifying the root cause, fixing, and verifying.
With this, you've completed the first module. You've built a solid foundation by understanding how your Java code actually executes and is managed within the JVM. In our next module, "Functional Foundations: Lambdas & Method References," we will shift our focus from the runtime environment to the code itself. You'll learn how to write more concise, expressive, and powerful code using features introduced in Java 8, which are now fundamental to modern Java development and a key topic in technical interviews.