Welcome back. In our previous lessons, you learned how to construct the three core financial statements. We started with the Balance Sheet as a static snapshot (), and then we built the Income Statement and Statement of Cash Flows to describe the performance and cash movements that occur between two Balance Sheet dates.
Today's lesson moves from construction to analysis. We will investigate the formal concept of articulation—the set of logical and mathematical linkages that bind the three statements into a single, cohesive, and internally consistent system. Your goal is to analyze how these statements interact, understanding them not as separate documents but as different projections of the same underlying economic reality. This perspective is the bedrock of all serious financial analysis and modeling.
Let's begin by establishing a conceptual framework for what articulation means.
A System of Statements
The idea that financial statements are interconnected is not just a useful convention; it's a foundational principle of accounting. The Financial Accounting Standards Board (FASB), which sets the rules for U.S. accounting, formalizes this concept.
[PDF] Statement of Financial Accounting Concepts No. 5 - FASB
This document from the FASB provides the authoritative, conceptual basis for financial reporting. We will read the section that defines and explains articulation.
Please read the following two sections: In the introduction, read the paragraph that begins "Financial statements are...". This formally states that the statements are a "fundamentally related set that articulate." Find the section titled "Complementary Nature of Financial Statements" and read it in its entirety (from the beginning to the end). Focus on how each statement provides an incomplete picture on its own and requires the others for meaningful interpretation.
The FASB text emphasizes that the statements "reflect different aspects of the same transactions." A single business event—like selling a product on credit—will ripple through the entire system. It impacts revenue on the Income Statement, Accounts Receivable on the Balance Sheet, and eventually, Cash from Operations on the Statement of Cash Flows.
This creates a system with two fundamental types of components, which we saw in our last lesson:
- Stocks (Points in Time): The Balance Sheet, which measures quantities held at a specific moment.
- Flows (Periods of Time): The Income Statement and Statement of Cash Flows, which measure activities over a duration.
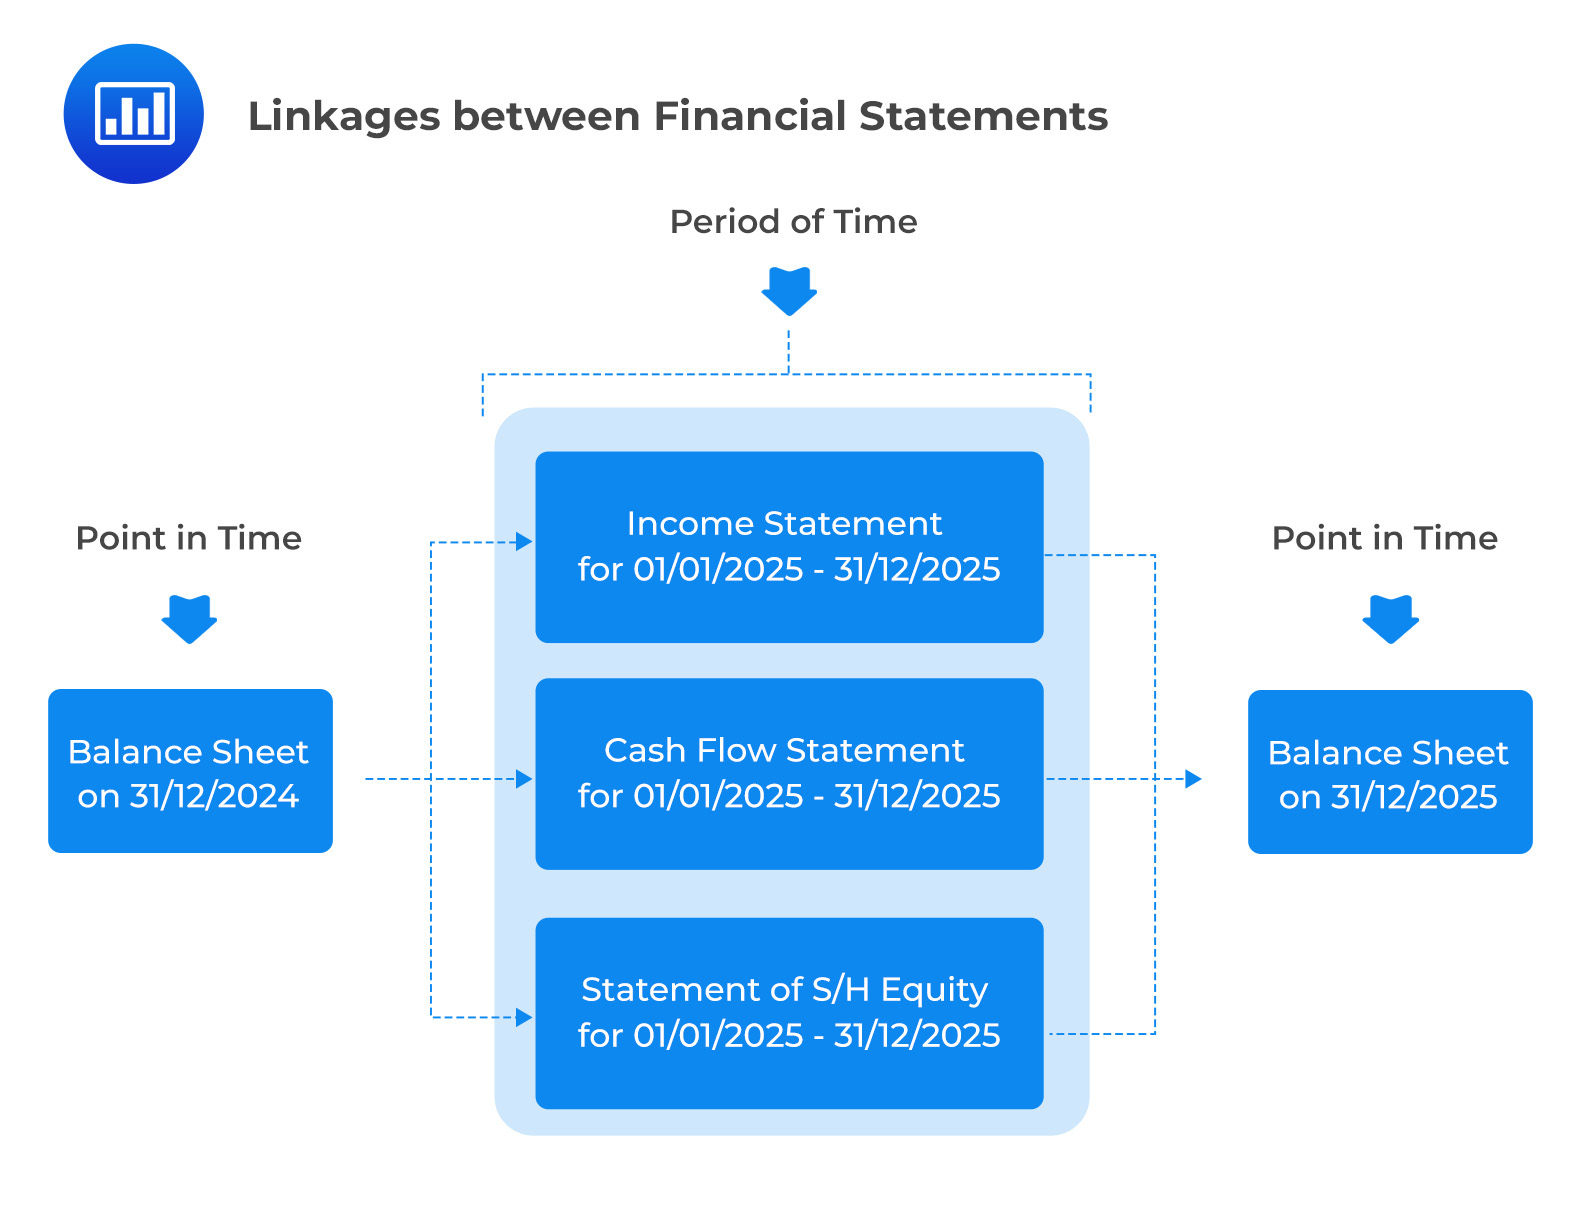
Our task now is to trace the specific mechanical links that connect these stocks and flows.
Tracing the Core Linkages
The articulation of the financial statements is driven by a few key items that appear on, or are calculated from, more than one statement. Let's trace the most important ones. The following image provides a helpful map of these connections, which we will deconstruct one by one.
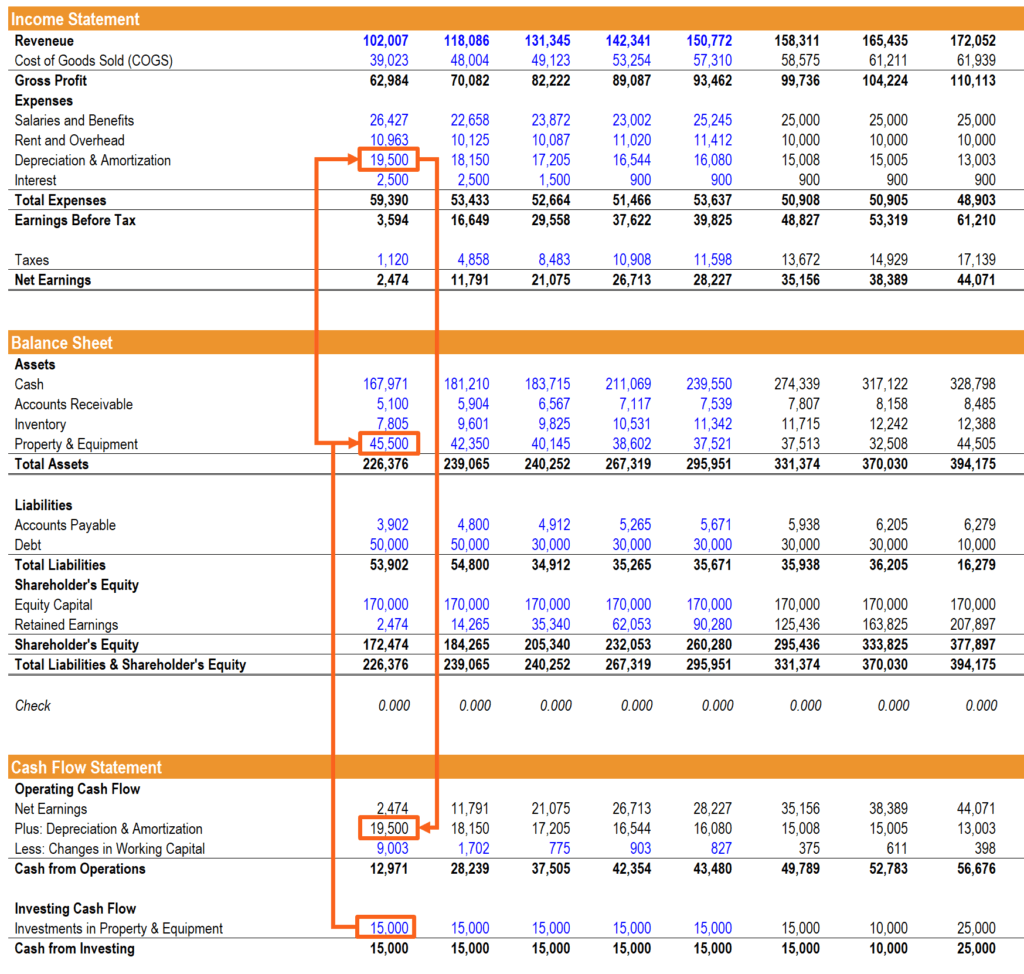
The Wall Street Prep article, "How are the Three Financial Statements Linked?", provides an excellent, practitioner-focused walkthrough of these connections.
How are the Three Financial Statements Linked?
This article breaks down the essential links from the perspective of a financial analyst or someone building a financial model.
Please read the sections titled: IS and CFS Linkage CFS and BS Linkage IS and BS Linkage The example answer, which provides a concise summary. As you read, focus on how each link acts as a channel for information to flow from one statement to another.
Let's synthesize this information into a structured analysis of the key linkages.
1. Net Income: The Primary Bridge
Net Income is the primary driver of articulation, connecting all three statements.
- IS to SCF: As you know from the previous lesson, Net Income is the starting point for the Statement of Cash Flows (using the indirect method). This establishes a direct link from the bottom of the Income Statement to the top of the Statement of Cash Flows.
- IS to BS: Net Income is the primary determinant of a company's change in equity. The profit generated in a period, less any amount paid out to owners as dividends, is added to Retained Earnings. This relationship is captured by the following "roll-forward" equation: This equation directly links the Income Statement's result to the Equity section of the Balance Sheet.
2. Reconciling Items: The Supporting Connections
The adjustments made in the Statement of Cash Flows create numerous secondary links.
- Non-Cash Expenses (e.g., Depreciation): Depreciation Expense is recorded on the Income Statement, reducing Net Income. Because it's a non-cash charge, it is added back on the Statement of Cash Flows. This connects the IS and the SCF. Furthermore, Depreciation Expense reduces the book value of Property, Plant & Equipment (PP&E) on the Balance Sheet.
- Capital Expenditures (Capex): When a company buys a new asset (a cash outflow in the Investing section of the SCF), the value of PP&E on the Balance Sheet increases. Capex does not appear on the Income Statement directly; its effect is recognized over time through depreciation.
- Changes in Working Capital: The operating section of the SCF adjusts for the change in current asset and liability accounts (e.g., Accounts Receivable, Inventory, Accounts Payable). These changes are calculated by comparing the beginning and ending Balance Sheets for the period. This creates a direct and crucial link between the Balance Sheet and the Statement of Cash Flows.
3. Cash: Closing the Loop
The entire system is designed to "solve" for the change in cash.
- SCF to BS: The sum of cash flows from operating, investing, and financing activities gives the net change in cash for the period. This net change, added to the beginning cash balance (from the prior period's Balance Sheet), calculates the ending cash balance. This ending cash balance is the figure that appears on the current period's Balance Sheet.
This final link is what makes the system "balance." The change in cash is the plug that ensures the fundamental accounting equation, , holds true after accounting for all the period's activities.
Seeing Articulation in Action: A Modeling Perspective
Understanding these links conceptually is one thing; seeing them work dynamically is another. The process of building a "3-statement model" in Excel, a core task in finance, is essentially an exercise in correctly programming these articulations.
The following video from Wall Street Prep demonstrates building a simplified 3-statement model from scratch. We will watch specific segments that highlight the key linkages we've discussed.
Build a 3-Statement Financial Model [Free Course]
This video walks through the construction of an integrated financial model. Watching how the model is built piece-by-piece provides a powerful illustration of articulation.
Please watch the following clips, paying close attention to which cells are being linked to create the formulas. Linking Net Income to Retained Earnings: Watch the section from retained earnings. Notice how the "Retained Earnings roll-forward" is built, with a formula that explicitly links to the Net Income line from the Income Statement. Linking Statements to Create the Cash Flow Statement: Watch the section from net income to CFO. Observe how Net Income from the IS is the first line item. Then see how Depreciation and Amortization are pulled from assumptions that also drive the IS and BS, and how the changes in working capital accounts are calculated by referencing the Balance Sheet. Closing the Loop with Cash: Watch the section from the finishing touches and then the critical revolver logic from negative cash. The first part shows the final cash balance from the SCF flowing back to the Balance Sheet, making the model "balance." The second, more advanced part shows how a "revolver" (a line of credit) is modeled to automatically borrow cash if the balance would otherwise go negative, demonstrating the truly dynamic nature of a fully articulated model.
The video demonstrates that financial statements are not just static reports but a dynamic system. A change in a single assumption, such as revenue growth, propagates through the entire model—affecting Net Income, which in turn affects Retained Earnings and the starting cash flow, altering the final cash balance and ensuring the next period's Balance Sheet remains in equilibrium.
Conclusion
In this lesson, we have moved beyond the construction of individual statements to analyze the system of articulation that connects them. You've seen that this is not an arbitrary set of rules, but a logical framework ensuring that the financial reports of a company are internally consistent.
Here are the key takeaways:
- Financial statements are a fundamentally related set that articulate, meaning they are interlinked and reflect different aspects of the same underlying transactions.
- The primary linkages are driven by Net Income, which connects the Income Statement to both the Statement of Cash Flows (as a starting point) and the Balance Sheet (via Retained Earnings).
- Numerous reconciling items create secondary connections, such as depreciation, capital expenditures, and changes in working capital accounts, which link all three statements.
- The system closes the loop with the ending cash balance from the Statement of Cash Flows becoming the cash asset on the new Balance Sheet, ensuring the accounting equation holds.
- This articulated structure is what allows for the creation of dynamic financial models, where a change in one assumption correctly propagates through the entire financial picture of the firm.
Now that you have a firm grasp of what the statements contain and how they connect, you are ready to use them for analysis. In our next lesson, we will delve into financial ratio analysis, learning how to calculate and interpret key metrics of a firm's liquidity, solvency, and profitability from its financial statements.