Welcome back. In our last lesson, we explored how the three financial statements articulate, forming a cohesive and internally consistent system. You learned that the Income Statement and Statement of Cash Flows describe the 'flow' of activities that connect the 'stock' represented by the Balance Sheet from one period to the next.
This lesson builds directly on that foundation. Now that you understand the structure of the data, we will turn to its interpretation. The goal is to analyze a firm's financial health by evaluating its liquidity, solvency, and profitability using financial ratios. We will move beyond merely calculating these numbers to understanding what they signify about a company's strategic performance and risk profile. We will cover the primary categories of ratios and then examine the DuPont framework—a powerful system for deconstructing shareholder return into its fundamental drivers.
The Language of Ratios: From Data to Insight
Financial statements present a vast amount of raw data. Financial ratios are the tools we use to process this data into standardized, comparable metrics. They allow us to compare a $100 billion conglomerate with a $50 million startup, or to track a single company's performance over decades. The ultimate purpose of ratio analysis is to answer critical questions about a company's operational efficiency, financial stability, and profitability.
Before we dive into specific formulas, it's crucial to distinguish between two fundamental aspects of a company's ability to meet its obligations: liquidity and solvency. These terms are often used interchangeably, but they represent distinct concepts.
This video from The Finance Storyteller provides an excellent and intuitive metaphor to distinguish between liquidity and solvency.
Please watch the introductory segment, which explains the concepts using the analogy of liquid and frozen assets (the metaphor). This will provide a strong conceptual anchor for the ratios that follow.
As the video illustrates:
- Liquidity refers to a company's ability to meet its short-term obligations (those due within one year). It's a question of having sufficient cash or assets that can be quickly converted to cash. A company can be profitable and solvent but still face a liquidity crisis.
- Solvency refers to a company's ability to meet its long-term obligations. It concerns the overall financial structure and whether assets exceed liabilities in the long run. An insolvent company is one where total liabilities are greater than total assets, leading to negative equity.
With this distinction in mind, we can group financial ratios into logical categories that each address a different dimension of the firm's health.
The Four Core Categories of Financial Ratios
Financial ratios are traditionally grouped into four main categories. We will examine the most important metrics from each.
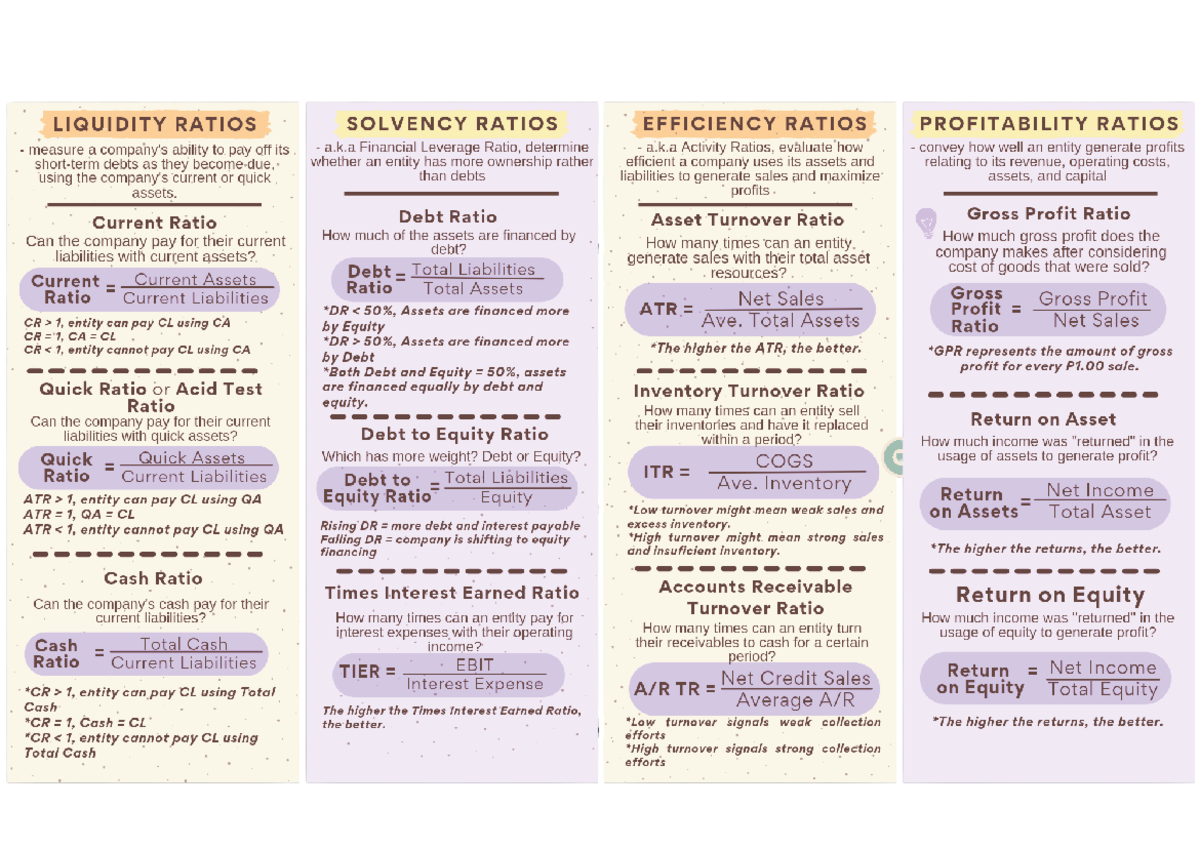
The following resource provides a comprehensive overview of these categories, their formulas, and their interpretation.
[PDF] FINANCIAL ANALYSIS AND CONTROL - BOU E-Book
This text offers a detailed breakdown of the major ratio categories, their formulas, and, importantly, how to interpret them.
Please read the following two parts from this document: First, familiarize yourself with the main categories by reading the section "Types of Financial Ratios". Note the classification into Liquidity, Debt (Solvency/Leverage), Profitability, and Activity (Efficiency). Next, study the section on interpretation. Start at the heading "Interpretation of Financial Ratios" and read through the discussions on the Current Ratio, Quick Ratio, Debt-Equity Ratio, Interest Coverage Ratio, Net Profit Margin, Return on Investment (similar to Return on Assets), Return on Equity, and Receivables Turnover. Pay close attention to the standard "norms" mentioned (e.g., 2:1 for the current ratio) and the logic behind the interpretations.
Let's synthesize and structure the key ratios from this reading.
1. Liquidity Ratios: Short-Term Viability
These ratios measure a firm's ability to pay its bills.
- Current Ratio =
- This is the most common liquidity measure. A ratio of 2:1 is often cited as a healthy benchmark, implying a $2 buffer of current assets for every $1 of current liabilities.
- Quick Ratio (Acid-Test Ratio) =
- This is a more stringent test of liquidity. It removes inventory from current assets because inventory can be difficult to sell quickly at full value, especially in a downturn. A benchmark of 1:1 is often considered safe.
2. Solvency (Leverage) Ratios: Long-Term Stability
These ratios measure a firm's ability to meet its long-term obligations and assess its overall capital structure.
- Debt-to-Equity Ratio =
- This measures how much debt a company is using to finance its assets relative to the amount of value represented in shareholders' equity. A higher ratio indicates higher financial risk (leverage).
- Interest Coverage Ratio =
- Also known as Times Interest Earned (TIE), this ratio assesses a company's ability to make its interest payments from its operating profits. A higher ratio signifies a greater capacity to service its debt. Creditors look for a comfortable margin here.
3. Profitability Ratios: Earning Power
These ratios measure how effectively a firm generates profit from its sales and assets.
- Net Profit Margin =
- This shows the percentage of each dollar of revenue that is left over after all expenses, including taxes and interest, are accounted for.
- Return on Equity (ROE) =
- This is a summary measure of profitability from the shareholders' perspective. It indicates how much profit the company generated for each dollar of equity invested. We use average equity to align the period-of-time measure (Net Income) with the stock measure (Equity).
4. Activity (Efficiency) Ratios: Asset Utilization
These ratios measure how efficiently a company is using its assets to generate sales.
- Total Asset Turnover =
- This ratio indicates the company's efficiency in using its entire asset base to generate revenue. A higher number suggests greater efficiency.
To see how these ratios are used in practice to diagnose a company's decline, let's return to the JC Penney case study.
This part of the video provides a compelling narrative of financial decline by tracking key ratios over time for the department store JC Penney.
Watch the case study from the beginning. As you watch, notice how the narrator connects the trends in different ratios (revenue decline, negative net income, exploding debt-to-equity, stable current ratio) to tell a comprehensive story about the company's deteriorating financial health.
The JC Penney example shows that a single ratio is insufficient. The story emerges from looking at the interplay between profitability, solvency, and liquidity over time.
Integrated Analysis: The DuPont System
While individual ratios are useful, a more powerful approach is to see how they connect. The DuPont analysis is a framework that deconstructs Return on Equity (ROE) into its constituent components. This allows an analyst to understand why ROE is what it is, and what levers management can pull to change it. Given your background, you can think of this as decomposing a primary performance metric into its multiplicative drivers to analyze its sensitivity to changes in profitability, efficiency, and financial structure.
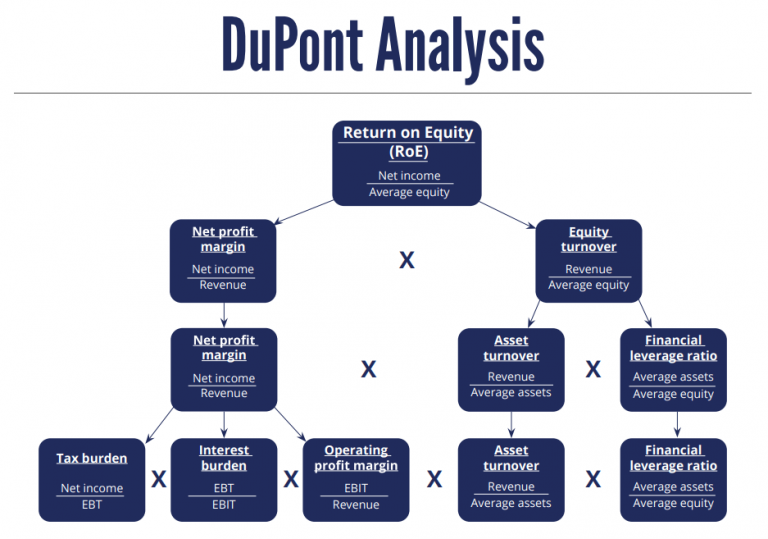
The video below gives an excellent walkthrough of this decomposition, from the basic 3-step formula to the more insightful 5-step version.
ROE DuPont Analysis - How to Use the DuPont Equation to Analyze a Stock - DuPont Decomposition
This video by "Learn to Invest" breaks down the DuPont analysis methodically, showing how ROE can be unpacked to reveal deeper insights into a company's performance.
Please watch the video in its entirety (DuPont analysis). Pay close attention to: The 3-step decomposition: \text{ROE} = (\text{Profitability}) \times (\text{Efficiency}) \times (\text{Leverage}). The 5-step decomposition, which further breaks down the profitability component. The example of using the framework to analyze a company's performance over time.
The 5-step DuPont decomposition can be expressed as:
Where the components are:
- Tax Burden: Measures the proportion of profit retained after paying taxes.
- Interest Burden: Measures the proportion of operating profit retained after paying interest.
- Operating Margin: Measures the core profitability from business operations.
- Asset Turnover: Measures asset use efficiency.
- Financial Leverage: Measures how much assets are financed by equity.
This framework is exceptionally powerful. It reveals that a company can achieve a high ROE through high margins (like a luxury brand), high turnover (like a discount retailer), or high leverage (like a bank). It also exposes risks: an ROE driven primarily by high leverage is much riskier than one driven by strong operating margins.
A Critical Perspective: Ratios in Context
Finally, it is essential to recognize that ratios are not immutable truths. Their values and their meanings are highly dependent on the economic environment.
Why Financial Ratios Break Down Across Market Cycl... | FMP
This article from Financial Modeling Prep introduces a critical and sophisticated perspective on ratio analysis, arguing that their interpretation must be cycle-aware.
Please read the first three sections: the introduction, "Ratios Are Snapshots...", and "Cycle Phases Change...". Focus on the core argument: ratios reflect conditions, not permanence, and their meaning can shift dramatically between expansionary and contractionary phases of the economy.
The key insight is that financial ratios are lagging indicators. During a market expansion, strong revenue growth can mask deteriorating operational efficiency or rising debt levels. Conversely, in a contraction, the same ratios can collapse rapidly as earnings fall, making a previously stable company look suddenly fragile. This dynamic nature is a crucial limitation that we must always consider.
Conclusion
In this lesson, we have equipped you with the primary tools for financial statement analysis. You have learned to move from the raw data of financial statements to meaningful insights about a company's health.
Here are the key takeaways:
- Financial ratios standardize financial data, enabling comparison across time and between companies of different sizes.
- The core categories of ratios assess liquidity (short-term health), solvency (long-term stability and risk), profitability (earning power), and activity (operational efficiency).
- The DuPont framework provides a systematic way to deconstruct Return on Equity, revealing whether shareholder returns are driven by profitability, asset efficiency, or financial leverage.
- Ratios are not static measures; their interpretation is highly context-dependent and must account for the phase of the broader economic cycle.
We have touched upon the idea that ratios have limitations. In our next lesson, we will dedicate our entire session to this topic, critiquing the limitations of financial statement analysis. We will explore how accounting choices, off-balance-sheet financing, and other factors can distort the picture presented by these financial reports.