Welcome back. In the previous lesson, you distinguished a shortage of cash needed now from losses large enough to make assets worth less than debts. That distinction helps here: a trader can be compelled to sell because of a funding or trading rule, even if the initial price decline was caused by something else.
This lesson compares two crashes through short case briefs. In 1929, borrowing to buy shares made falling prices especially damaging to investors’ equity and could prompt margin calls. In 1987, a strategy called portfolio insurance called for more selling as prices fell. Both could reinforce a decline, but neither is a complete explanation of why the decline began.
Case brief: 1929 and debt-financed shares
The market entered 1929 after a boom in which investors could buy stocks with borrowed money. Federal Reserve History describes purchases made with down payments that were often only 10 percent of the price, with the shares serving as collateral for the remainder. The Dow fell nearly 13 percent on October 28 and nearly 12 percent the next day. Those two days were the crash’s dramatic opening, not the whole subsequent decline.
Read Federal Reserve History’s account for the borrowing arrangements before the crash and the difference between the sharp October break and the longer fall.
In the opening discussion of the boom, find the paragraph beginning “The financial boom occurred during an era of optimism.” Read the boom account, focusing on the down payment and the role of shares as collateral. In the crash account, read the opening dates. Later, find the paragraph beginning “In September 1929, stock prices gyrated” and read the market turn. You can skip the intervening discussion of Federal Reserve policy for this lesson.
The borrowing arrangement gives us a way to see the amplification. Suppose a share portfolio costs , purchased with of the investor’s money and borrowed. If its value falls by 5 percent while the debt remains , the investor’s equity is only :
A 5 percent loss in the shares has erased half of the investor’s initial . If the broker’s maintenance requirement is breached, the investor must provide more cash or collateral, or have shares sold to reduce the loan. The exact point at which a call occurs depends on the applicable requirement; a price fall alone does not establish that every account received one.
The Federal Reserve Bank of Boston sets out this commonly cited mechanism while also framing it as an explanation to examine, rather than a complete account of the crash.
Perspective: Is Margin Lending Marginal? - Federal Reserve Bank of Boston
Read the Federal Reserve Bank of Boston’s opening paragraph to connect margin borrowing to the selling pressure that can follow a decline.
In the first paragraph of the main article, beginning with a reference to John Kenneth Galbraith’s The Great Crash: 1929, read the margin account. Focus on its contrast between borrowing during rising prices and liquidation during falling prices. Notice that it calls this the “popular view,” not proof that margin calls explain every sale.
The feedback depends on how many investors face the constraint at once. When a few borrowers can deposit cash, they need not sell. When many cannot, their sales arrive alongside voluntary sales from investors whose outlook has changed. If buyers are unwilling to take all those shares at the previous price, the next sales execute at lower prices. That can weaken still more borrowers’ collateral and generate further calls. Margin debt turned a price decline into a possible requirement to find cash or sell. It did not, by itself, supply the first reason investors revised prices downward.

The long trajectory matters when comparing cases. The roughly 89 percent peak-to-1932-trough fall was not a one-day crash, and the Great Depression cannot be attributed solely to margin selling in October 1929. The chart also shows an index level, not the total return, including dividends, earned by every investor.
Case brief: 1987 and portfolio insurance
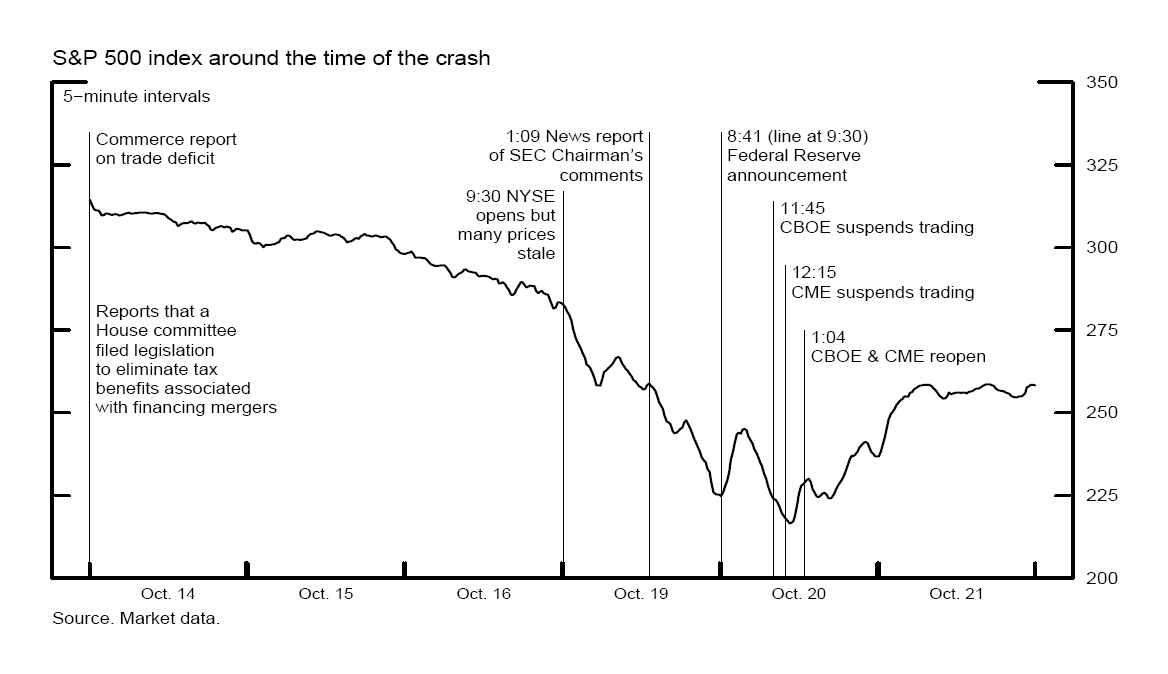
On October 19, 1987—another Black Monday—the Dow fell 22.6 percent in one session. Prices had already weakened during the preceding week amid economic and policy news. Unlike the 1929 margin borrower, a portfolio insurer did not necessarily need to sell because a broker demanded repayment. The strategy itself prescribed reducing exposure as the market fell.
Here portfolio insurance means a trading strategy, not a guaranteed insurance contract. A manager holding shares could sell stock-index futures to offset some losses if share prices fell. As prices fell further, the strategy called for a larger hedge. Protection depended on being able to trade at workable prices; it could not guarantee a floor during a fast-moving market.
Patrick Boyle’s The 1987 Crash supplies the case details. Concentrate on the initial sources of unease and then on how selling in futures and shares could interact.
Watch selected parts of Patrick Boyle’s “The 1987 Crash” for the size of the fall, the preceding news, and the portfolio-insurance mechanism. The account also explains why calling portfolio insurance the sole cause would go too far.
Watch the comparison for the scale and aftermath of the 1987 fall. In the segment beginning at 00:02:16, watch the preceding news about valuations, tax proposals, and the trade deficit; you can skip the remaining pre-crash trading details. Then watch the trading mechanism. Pay particular attention to the explanations of portfolio insurance around 00:06:09, index arbitrage around 00:07:35, and the caution about other sellers near the end.
Why might selling futures affect share prices? An index future is a contract whose price is linked to an equity index. If heavy selling makes futures cheap relative to the underlying shares, traders seeking to exploit the gap may buy futures and sell shares. In 1987, delayed openings and stale share prices made that relationship harder to judge, while order-processing delays added uncertainty. Futures selling did not automatically produce an equal amount of share selling: the link depended on other traders’ ability and willingness to execute.
The reinforcing pattern was nevertheless clear. Falling share prices called for larger portfolio-insurance hedges. Heavy futures sales could put pressure on share prices through linked trading, while other investors might sell because they expected further declines. Lower share prices then called for still more hedging. In a market with too few willing buyers at prevailing prices, orders that might have been manageable separately could have a much larger combined price impact.
Portfolio insurance was an amplifier, not a sufficient explanation. As Boyle notes, many participants who were not using it also sold, and markets without the same strategy experienced sharp declines. Conversely, describing the strategy’s feedback loop does not tell us precisely which news item initiated the fall or why that particular day produced such an extreme result.
Put the mechanisms side by side
| 1929: margin debt | 1987: portfolio insurance | |
|---|---|---|
| Exposure before the fall | Shares bought partly with loans, using the shares as collateral | Equity holdings paired with a strategy for reducing exposure when prices fell |
| Pressure as prices fell | Shrinking investor equity could trigger a requirement for cash, collateral, or loan-reducing sales | The strategy called for larger share sales or futures hedges |
| Why selling might spread | Forced share sales could lower prices and put more borrowers below margin requirements | Futures sales, linked share trading, and anticipated further selling could reinforce one another |
| Important qualification | Not every borrower faced a call or had to sell | Not every sale was portfolio insurance, nor did every futures sale mechanically become a share sale |
Both cases illustrate the same broader principle from earlier lessons: an initial fall can alter what market participants are able or committed to do next. Their responses may add sales just when market liquidity is weakest. But the constraints differed. The central 1929 margin mechanism began with debt and collateral requirements; the central 1987 portfolio-insurance mechanism began with a rule for adjusting risk exposure. Margin and other funding pressures were not absent in 1987, and deliberate risk reduction was not absent in 1929. These are comparisons of prominent amplification mechanisms, not exclusive labels for each crash.
Key takeaways
A useful historical explanation separates the conditions before a fall, possible initial reasons for repricing, and the mechanisms that magnified selling afterward. Margin debt can make a modest share-price loss devastate a borrower’s equity and produce collateral-driven sales. Portfolio insurance can make a decline call for additional hedging sales, potentially connecting pressure in futures with pressure in shares. Neither mechanism alone identifies a single, certain trigger.
The next lesson turns to 2008 and March 2020. The same distinction between an initial shock and financial amplification will help you compare crises whose stress reached equity markets by different routes.