The last lesson compared two ways selling could reinforce a fall: margin calls in 1929 and portfolio-insurance trading in 1987. The same distinction between what starts a decline and what amplifies it helps with 2008 and March 2020. Both brought sharp equity losses and funding stress, but the shocks entered the financial system from different directions.
This lesson uses two short case briefs. In each, trace the initial shock, the pressure it placed on investors or lenders, and the routes by which that pressure reached share prices.
Case brief: 2008 — trouble builds inside finance
The 2008 crisis did not begin with the September collapse of a single firm. Problems had been developing as borrowers struggled with mortgages and falling house prices reduced the value of assets backed by those loans. Many financial institutions held mortgage-linked securities, sometimes using substantial borrowing to do so. Losses therefore threatened not just an investment’s return but, for some institutions, the adequacy of their capital.
How It Happened – The 2008 Financial Crisis, from CrashCourse, gives a compact account of how mortgages reached investors and how losses spread. It simplifies a complicated history, so use it to identify the transmission channels rather than to assign every event a single cause.
How it Happened - The 2008 Financial Crisis: Crash Course Economics #12
Watch the CrashCourse account to see how mortgage losses became a wider financial crisis.
Watch the buildup for mortgage-backed securities and the deterioration in lending standards. Then watch the unraveling for falling house prices, losses at financial institutions, uncertainty about their exposures, and the freeze in credit markets. Focus on why a housing loss could matter to investors who owned no houses.
A mortgage-backed security gives its holder a claim on payments from a pool of home loans. Pooling loans can distribute some risks, but it does not make widespread mortgage defaults disappear. As defaults rose and house prices fell, investors revised down the value of these securities. For a highly leveraged institution, a loss on assets also sharply reduced the owners’ equity—the mechanism you calculated earlier in the course.
That created two related problems. Solvency concerns arose where losses might leave an institution’s assets worth less than its obligations. Funding concerns arose where a lender might refuse to renew short-term financing or demand more collateral, even before an institution’s ultimate solvency was clear. Uncertainty about who held how much mortgage risk made institutions more wary of lending to one another. The September 2008 failure of Lehman Brothers intensified an already developing crisis; it was not its original cause.
Stress reached equities by more than one route. Investors marked down shares of financial firms facing losses or uncertain financing. They also marked down shares of other businesses as restricted credit and a worsening economy threatened future earnings, even where current earnings had not yet changed. Meanwhile, an investor or institution needing cash could sell assets it was able to sell, including shares. When many sellers sought cash at once and buyers demanded lower prices to take risk, those sales could magnify the fall.
The distinction: deteriorating housing loans and mortgage-linked assets were central to the initial financial shock. Leverage, fragile funding, uncertainty about counterparties, and cash-driven asset sales helped turn that shock into a broader crisis and equity decline. Not every falling share price was a forced sale; much of the repricing reflected a worse outlook for businesses.
Case brief: March 2020 — an outside shock meets a dash for cash
March 2020 began differently. The pandemic and measures taken to contain it disrupted travel, workplaces, supply chains, and spending. Investors rapidly revised expectations for business revenues and earnings. That was an external shock to finance, not a loss that first emerged from a stock or mortgage portfolio.
The Financial Stability Board’s Holistic Review of the March Market Turmoil makes this contrast explicit.
Holistic review of the March market turmoil
Read the Financial Stability Board’s account of the pandemic’s initial economic shock before considering the financial feedback that followed.
In Section 3.1, “The COVID-19 shock” (around printed p. 10), read the shock account. The passage begins with disrupted supply and demand and ends with the difficulty of pricing assets amid uncertainty. Note the report’s contrast with 2008: the shock came from outside the financial system, although markets still experienced severe disruption.
The first equity-market response needs no forced-selling story. If a company may earn less for an unknown period, investors can offer less for its shares today. But the speed and breadth of the shock also made cash unusually valuable. Businesses sought funds to keep operating; investors sought cash to meet obligations or reduce risk. The resulting dash for cash affected markets for bonds and short-term borrowing as well as equities.
Read the report’s selected passages below as a connected account: withdrawals and cash needs generated sales, while intermediaries struggled to absorb all the assets offered.
Holistic review of the March market turmoil
Continue with the Financial Stability Board’s account of how the initial shock propagated through markets.
In Section 4.2, “Factors shifting demand and supply of liquidity,” read the “Demand for liquidity” passage on printed pp. 21–22, from portfolio shifts into cash-like holdings. Just after the discussion of money market funds and before Graph 4.2, read the fund outflows; notice that equity funds were among those seeing withdrawals. Under “Supply of liquidity” on pp. 23–24, read from dealer capacity, ending with the discussion of wider bid-offer spreads. Finally, in Section 4.3, “The propagation of liquidity stress,” under “Propagation through core government bond markets” on p. 31, read the closing paragraph before Graph 4.6, from the feedback. Connect the need for cash with the limited willingness or ability of buyers to absorb sales.
An investor withdrawing money from a fund does not personally place a sell order for every asset the fund owns. But the fund must obtain cash to meet redemptions. Likewise, a participant facing a margin call may need cash promptly. Funds and other investors can respond by selling assets, drawing on cash buffers, or finding financing; sales are one possible response, not an automatic consequence of every withdrawal or margin call.
When sales do occur, the order-book principle from the first module applies: if willing buyers are scarce at current prices, a large flow of sell orders has greater price impact. In March 2020, strains in other markets could add to pressure on equities when investors sold shares to raise cash. At the same time, expected losses in the real economy provided a separate reason for shares to fall. The financial feedback intensified stress; it did not create the pandemic.
The report also draws an important limit to the comparison. Banks entered 2020 generally better equipped to absorb stress than they had been in 2008, although severe strains still appeared in funding markets and among non-bank investors. Calling 2020 a dash for cash should not imply that it was simply 2008 repeated.
Compare the paths into equity selling
The supplied chart places part of the 2008 decline beside the early 2020 decline. Use it to see their different timelines, not to infer that a similar-looking segment predicts what comes next.
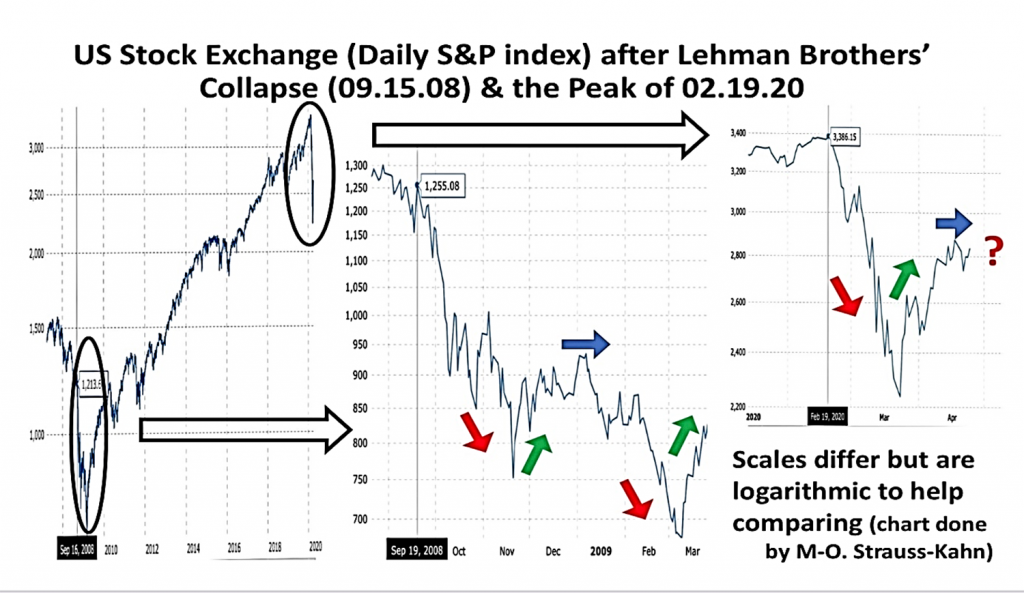
A logarithmic scale helps show proportional moves within a panel. Here the panels use different scales and starting dates; the image’s arrows and question mark are annotations, not evidence of a repeatable recovery path. It also shows index prices, not which trades were voluntary or compelled.
| 2008 financial crisis | March 2020 pandemic shock | |
|---|---|---|
| Initial shock | Deteriorating mortgage loans and housing-linked assets exposed weaknesses within finance | A pandemic and containment measures abruptly disrupted economic activity outside finance |
| Direct reason to reprice shares | Financial-firm losses and a worsening credit and earnings outlook | An abrupt worsening of expected revenues and earnings across many businesses |
| Financial amplification | Leverage, funding withdrawals, uncertain exposures, and sales to raise cash | A dash for cash, fund withdrawals, margin demands, and limited capacity to absorb sales |
| Essential qualification | The crisis developed before the most dramatic September events | The pandemic was not caused by financial selling, and banking stress was not identical to 2008 |
These cases have a shared market mechanism without having a shared origin: changed expectations lower the prices investors will pay; urgent sales can then meet too few willing buyers at those prices. Liquidity matters most when the need to sell is widespread and time-sensitive. Historical explanations are strongest when they specify whose cash need or loss changed, why it changed, and how that could produce equity selling, rather than treating every price fall as evidence of the same hidden cause.
Key takeaways
In 2008, losses rooted in housing and mortgage-linked finance were magnified by leverage, funding fragility, and uncertainty, with stress reaching equities through both worsening earnings expectations and cash-driven sales. In March 2020, a sudden real-economy shock first changed the earnings outlook; a dash for cash and strained market liquidity then amplified the turmoil. In neither case does an amplification mechanism alone explain every sale or identify one precise moment when the decline had to occur.
The next module turns from historical mechanisms to safeguards and responses: when circuit breakers pause trading, what policy measures try to relieve, and why explaining a vulnerability is easier than reliably predicting the next crash.