Hello. Last lesson explained why a share price can fall even when current earnings have not changed: investors may revise their expectations of future profits, risk, or other investors’ willingness to buy. This lesson examines how those changing decisions become trades. You will use a simple order book to see why the same sell order can barely move a price in one market but push it much lower in another.
The prices waiting on either side of a trade
An order book displays orders waiting to trade. A bid is an offer to buy at a stated price; an ask is an offer to sell at a stated price. Each has a quantity as well as a price. The highest available bid is the best bid, and the lowest available ask is the best ask. Their difference is the bid–ask spread.
Watch the opening order-book illustration in Limit order book / Fundamentals of trading / Episode 4 by Initial Return. Focus on identifying the buying side, the selling side, and the two prices nearest the gap between them.
Limit order book / Fundamentals of trading / Episode 4
Initial Return’s “Limit order book / Fundamentals of trading / Episode 4” gives a visual introduction to bids, asks, and the spread.
Watch the book layout. The best bid is the highest price offered by a waiting buyer; the best ask is the lowest price requested by a waiting seller. Concentrate on which side an incoming seller would need to trade against.
A trader who submits a buy limit order names the most they will pay; a trader who submits a sell limit order names the least they will accept. An order that cannot trade immediately can wait in the book. By contrast, an incoming market sell order seeks to sell promptly at the best available buying prices. It trades against bids, not against the sell orders on the ask side.
The SimTrade article Understanding the Order Book: Analyzing Market Liquidity explains that distinction and introduces depth: how much quantity is available at the best price and at prices further down the book.
Understanding the Order Book: Analyzing Market Liquidity - SimTrade blog
Read these short sections of the SimTrade article to connect the visual book with the types of orders that add or use available liquidity.
Under “Evolution of the order book,” begin at “The order book constantly evolves as new orders arrive” and read the order types, stopping before “Order priority rules.” Then, under “Liquidity characteristics of the order book,” read from “The order book provides several indicators” through the definition of market breadth: the liquidity measures. Focus especially on why the spread and depth describe different features of liquidity.
The image below shows an order book for a USD-priced financial instrument; it is not a stock example. The green rows are waiting bids and the red rows are waiting asks. Its purpose here is to show the book’s shape, not to suggest that its particular prices or quantities apply to shares.
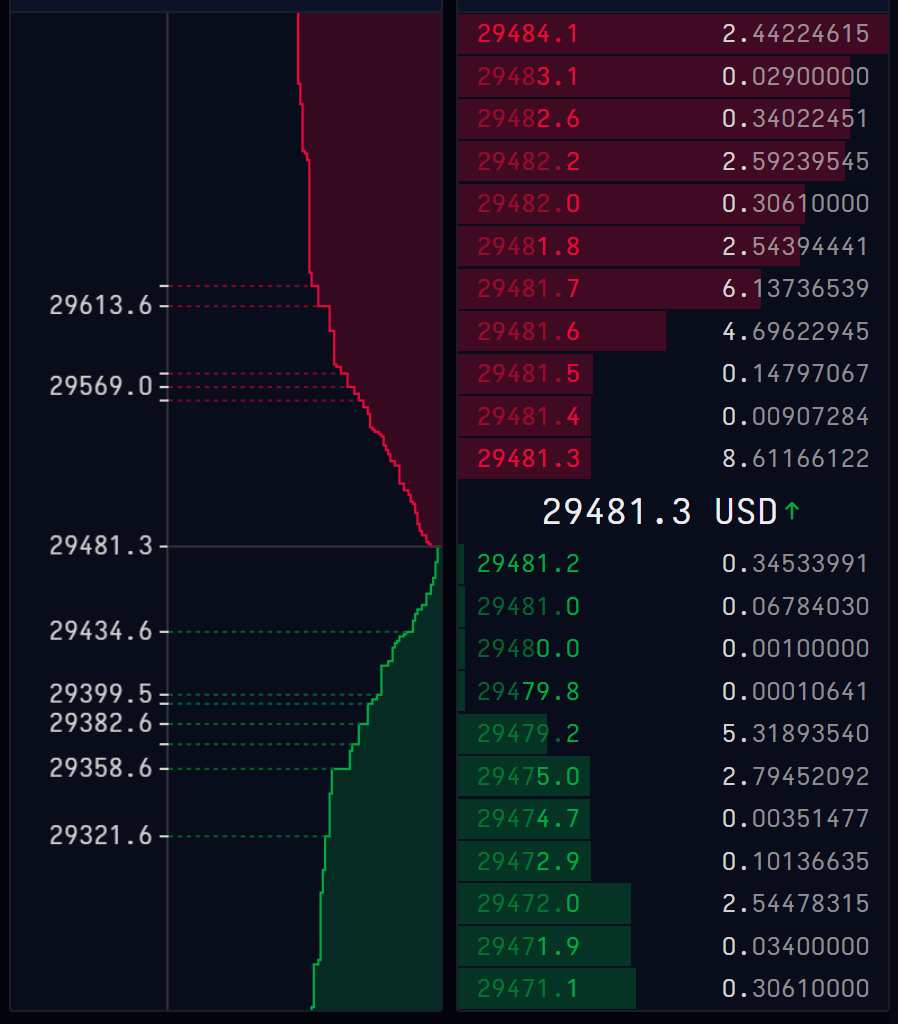
Near the displayed price, a bid at USD has roughly units available. A seller wanting to sell more than that could not assume the entire order would fill at . The next available bids—and their quantities—would matter. Because a book can change quickly, this image is only a snapshot, not a promise that those orders will still be there when someone trades.
Following one market sell order
Suppose the last trade in a hypothetical share occurred at USD. The best bid is also USD, the best ask is USD, and a seller submits a market sell order for 100 shares. Imagine first that the waiting bids are:
| Bid price, USD per share | Shares buyers will take |
|---|---|
| 20 | |
| 20 | |
| 20 | |
| 80 |
Matching starts with the best bid. Only 20 shares can sell at , so 80 remain. Another 20 sell at , then 20 at . The final 40 sell at . One incoming order has therefore produced trades at four prices, not one.
The seller’s average execution price accounts for how many shares traded at each price:
That average is about USD, but the last trade in this sequence is at USD. With 40 shares still bid at , the new best bid is also USD. These are three different descriptions: the average price received across all 100 shares, the price of the final trade, and the best bid remaining afterward. Calling all three “the price” would conceal what happened.
The short demonstration in How orders affect the order book by Udacity shows the same process with different numbers. Watch how a 175-share market sell order uses up the highest bids before reaching a substantially lower bid.
How orders affect the order book
Udacity’s “How orders affect the order book” animates a market sell order filling at several bid prices, making the order’s path through the book visible.
Watch the sell order. Follow the separate fills of 100 shares at 99.95, 50 at 99.90, and 25 at 99.05. Notice that the seller reaches the lowest price only after the higher bids have been used up.
This is price impact in the immediate order-book sense: executing the sell order uses available buying interest and results in trades at lower prices. A gap between bids can make the final step look abrupt. It does not mean every share changed hands at that lowest price, nor does the order book alone tell us whether the share’s long-run value has changed.
Same sell order, different liquidity
Now hold the sell order fixed at 100 shares, but compare two books just before it arrives. Both have a best bid of USD and a best ask of USD.
| Bid price, USD per share | Shares bid in a deep book | Shares bid in a thin book |
|---|---|---|
| 500 | 20 | |
| 200 | 20 | |
| 300 | 20 | |
| 400 | 80 |
The thin book is the one we just followed: the 100-share order reaches USD. In the deep book, all 100 shares sell at USD, and 400 shares remain bid at that price. The order size and starting best bid were identical. What changed was the quantity buyers were prepared to take near that price.
This is the central link between liquidity and price impact. For this purpose, a liquid market is one in which shares can be sold promptly without a substantial concession in price. A deep collection of bids near the current price can absorb selling. When those bids are small or separated by large price gaps, an otherwise identical market sell order must reach lower prices to find enough buyers.
Revisit the later demonstration in Initial Return’s video. It compares a sell order that consumes several bid levels with a counterfactual in which much more buying interest is available at the best bid.
Limit order book / Fundamentals of trading / Episode 4
Return to Initial Return’s order-book video for its direct comparison of thinner and deeper buying interest.
Watch depth and impact. Pay particular attention to the contrast beginning at 00:15:19: when enough shares are bid at the top price, the same incoming sell order need not push the best bid down.
Notice a useful subtlety in our two books: their initial bid–ask spreads are the same— USD—yet their response to the 100-share sell order differs greatly. The spread tells us the gap between the best quoted buying and selling prices. It does not, by itself, tell us how many shares can trade at those prices. To assess the likely impact of an order of a given size, we also need bid-side depth at and below the best bid.
If the ask remained at USD after our thin-book example, the new best bid of USD would also leave a wider quoted spread. That is an after-trade observation; the crucial difference between the two books existed before the trade, in their bid quantities.
What the book can—and cannot—explain
An order book provides a mechanical explanation for how selling can move a traded price. It does not provide a complete explanation for why people want to sell or why buyers offer particular prices. News might reduce buyers’ estimates of future earnings; concern about risk might make them less willing to hold shares; or buyers might step back because they expect further selling. Those possibilities from the previous lesson can all show up as fewer bids or lower bid prices.
Nor is a book fixed while an order travels through it. New bids can arrive, existing bids can be cancelled, and quantities can change. Our worked comparison deliberately freezes the book so you can isolate the effect of depth. In a fast-moving market, displayed depth may disappear before a seller reaches it—or new buyers may appear. A market sell order therefore gives the seller less control over the execution price than an order with a minimum acceptable selling price. The trade-off is that a sell limit order may wait or may not execute at all.
Finally, a last trade at USD is evidence that some shares traded there. It does not imply that all shareholders sold at , or that a 100-share order by itself establishes the company’s value. Immediate trading impact and a durable reassessment of value are related possibilities, not interchangeable conclusions.
Key takeaways
A market sell order meets the highest available bids first. If those bids cannot absorb the full order, the remaining shares sell at successively lower available bids. Low liquidity on the buying side—little depth near the best bid or large gaps between bids—makes the same sell order more likely to produce a lower final trade and a worse average execution price. The bid–ask spread is useful, but it cannot substitute for examining the quantities behind the bids.
You can now connect an investor’s decision to sell with an actual price change. The next module adds leverage: when falling prices strain debt-financed positions, some owners may have to sell, potentially sending more orders into a market whose available bids are already thin.