Welcome to the final module of our course! You've successfully built a feature-rich whiteboard application, from the rendering engine to the document export functionality. The last piece of the puzzle, and a critical one given your interest in high-performance systems, is ensuring the application runs as efficiently as possible. This lesson and the next are dedicated to the art and science of performance optimization.
Today's learning outcome is to profile the application's frame time and memory allocations using a performance analysis tool like Tracy or Perf. We'll move from "does it work?" to "how fast does it work?". This process is fundamental in low-level engineering and system programming. You'll learn how to gather the raw data that exposes where your program spends its time and memory, setting the stage for targeted optimization.
In our previous lesson, we completed the export feature by programmatically generating .tex files. Now, we shift our focus from features to the non-functional requirement that has been our goal from the start: performance.
What is Performance Profiling?
Before you can optimize your code, you must first measure it. "Premature optimization is the root of all evil" is a famous maxim in programming, but its corollary is that once your program is correct and feature-complete, informed optimization is the mark of a skilled engineer. Profiling is the process of measuring your application's behavior to gather that information.
There are two primary methods of profiling:
-
Instrumentation: This involves adding code to your program to explicitly mark the beginning and end of sections you want to measure. The profiler then records the exact duration and other metrics for these marked "zones." This is precise but requires modifying your source code.
-
Sampling: A sampling profiler periodically interrupts your program (many times per second) and records the function currently being executed. Over time, this builds a statistical picture of where the program is spending most of its time. This method requires no code changes but is statistical rather than exact.
In this lesson, we will explore tools that utilize both of these powerful techniques.
Tracy: A Real-Time Visual Profiler
For a real-time graphical application like your whiteboard, a visual profiler that can show you performance data as the program runs is invaluable. Tracy is a modern, low-overhead, frame-based profiler designed for C++ and game development, making it a perfect tool for our needs.
The CppCon 2023 talk by Marcos Slomp, "An Introduction to Tracy Profiler in C++," is an excellent and comprehensive guide to what Tracy is and what it can do.
An Introduction to Tracy Profiler in C++ - Marcos Slomp - CppCon 2023
This video provides a fantastic overview of Tracy. The first few minutes set the stage for why such a tool is revolutionary for C++ developers.
Watch the introduction to understand Tracy's key features, such as its real-time nature and low overhead (key features). Then, pay close attention to the speaker's explanation of tracing, sampling, and instrumentation (profiling concepts), as this provides the conceptual foundation for everything we'll do.
Integrating Tracy into Your Project
Integrating Tracy into a CMake project is straightforward. You add its source as a subdirectory and link against the TracyClient library. Crucially, Tracy's macros are only activated when the TRACY_ENABLE preprocessor directive is defined, meaning you can leave the instrumentation in your release code with zero overhead.
Real-Time Performance Profiling for C++ Developers
This blog post provides a concise guide to getting Tracy up and running in a C++ project.
Review the "Getting Started with Tracy" section. Focus on the CMake integration and the need for the TRACY_ENABLE define. The code snippets provide a clear template for your own CMakeLists.txt.
Here is a typical CMake setup:
# Add Tracy as a subdirectory (assuming it's in an 'external' folder)
add_subdirectory(external/tracy)


# Link your executable against the Tracy client library
target_link_libraries(YourApp PRIVATE TracyClient)


# Enable Tracy's macros for this target
target_compile_definitions(YourApp PRIVATE TRACY_ENABLE)
With this setup, you just need to include the Tracy.hpp header in the source files you wish to profile.
Profiling Frame Time with ZoneScoped and FrameMark
The most common task in profiling a real-time application is analyzing what happens within a single frame. Tracy makes this incredibly easy.
ZoneScoped: This is Tracy's primary macro. You place it at the beginning of any scope (a function, anifblock, aforloop), and Tracy will automatically measure the time from when the macro is declared until the end of its scope. This is a perfect example of the RAII idiom we discussed in Module 1.FrameMark: This macro signals to Tracy the end of a frame. By placing this at the end of your main loop, you provide Tracy with the boundaries it needs to display frame-by-frame statistics.
Let's see how you would instrument the main application loop we designed in Module 3:
#include "Tracy.hpp"

// ... in your main loop ...
while (isRunning) {
    ZoneScopedN("Main Loop"); // Give the whole loop a name

    // --- Event Handling ---
    {
        ZoneScopedN("Event Polling");
        // Your SDL_PollEvent loop
    }

    // --- Fixed-Timestep Update ---
    while (accumulator >= fixed_timestep) {
        ZoneScopedN("Update");
        // update(fixed_timestep);
        accumulator -= fixed_timestep;
    }

    // --- Rendering ---
    {
        ZoneScopedN("Render");
        // render();
    }

    // Mark the end of the frame for Tracy
    FrameMark;
}
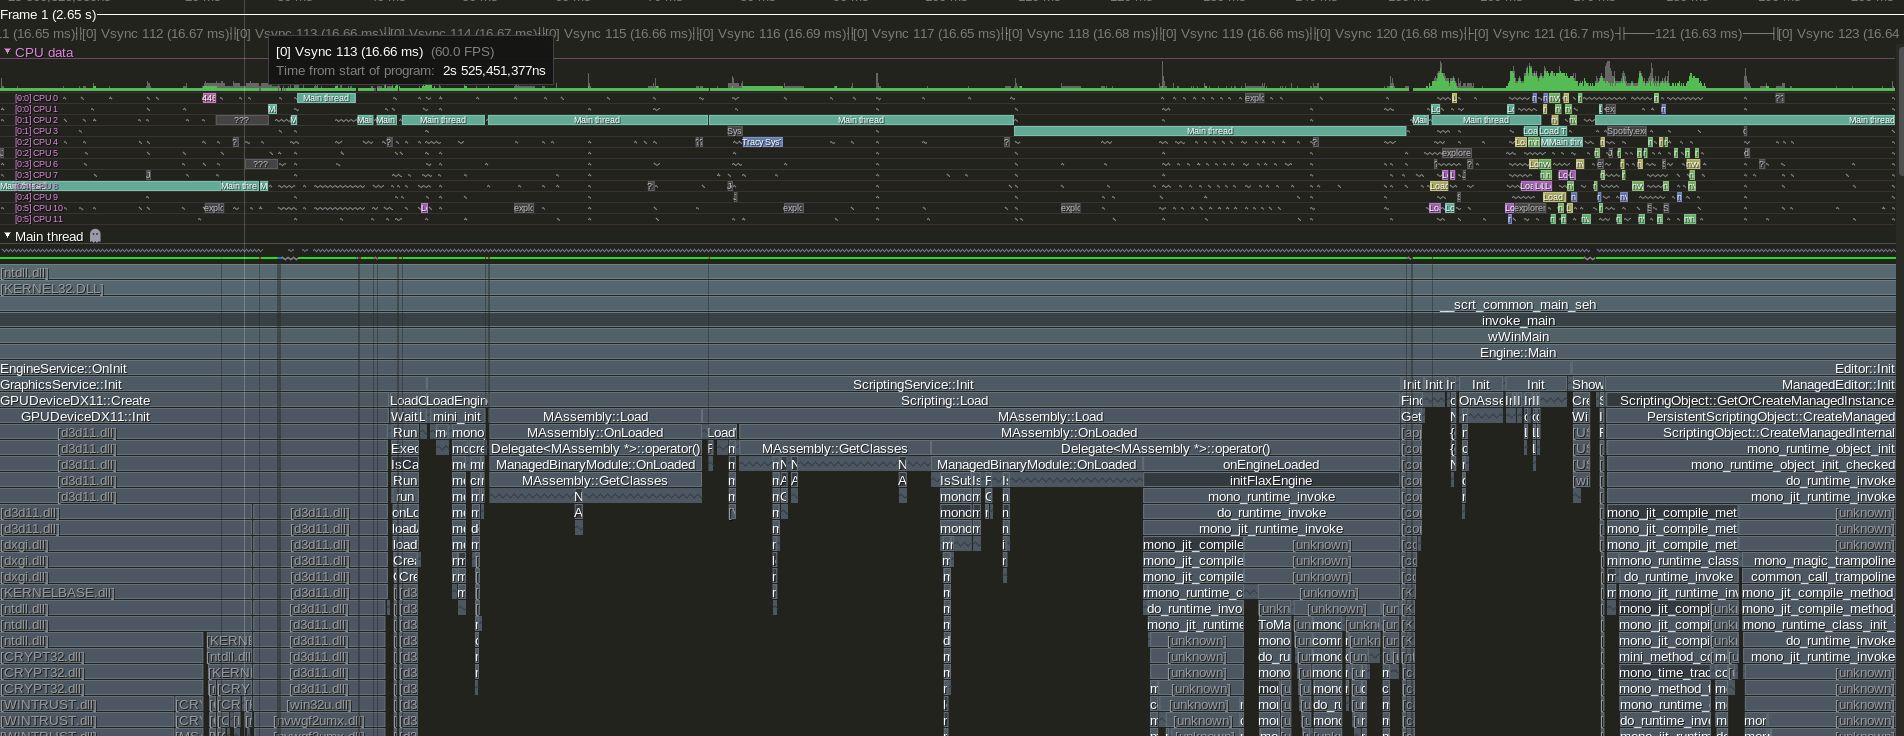
When you run this instrumented application while the Tracy GUI is active, you will see a detailed, hierarchical breakdown of where time is being spent in each frame.
Profiling Memory Allocations
Understanding memory usage is just as critical as understanding CPU time. Excessive allocations, or allocations at the wrong time (e.g., during rendering), can cause significant performance stalls. Tracy provides tools to track memory.
The most robust way to track all heap allocations is to override the global operator new and operator delete. This allows Tracy to intercept every new and delete call in your application.
#include "Tracy.hpp"

// In ONE of your .cpp files, enable memory tracking and override new/delete


#ifdef TRACY_ENABLE
void* operator new(std::size_t count) {
    auto ptr = malloc(count);
    TracyAlloc(ptr, count);
    return ptr;
}

void operator delete(void* ptr) noexcept {
    TracyFree(ptr);
    free(ptr);
}


#endif
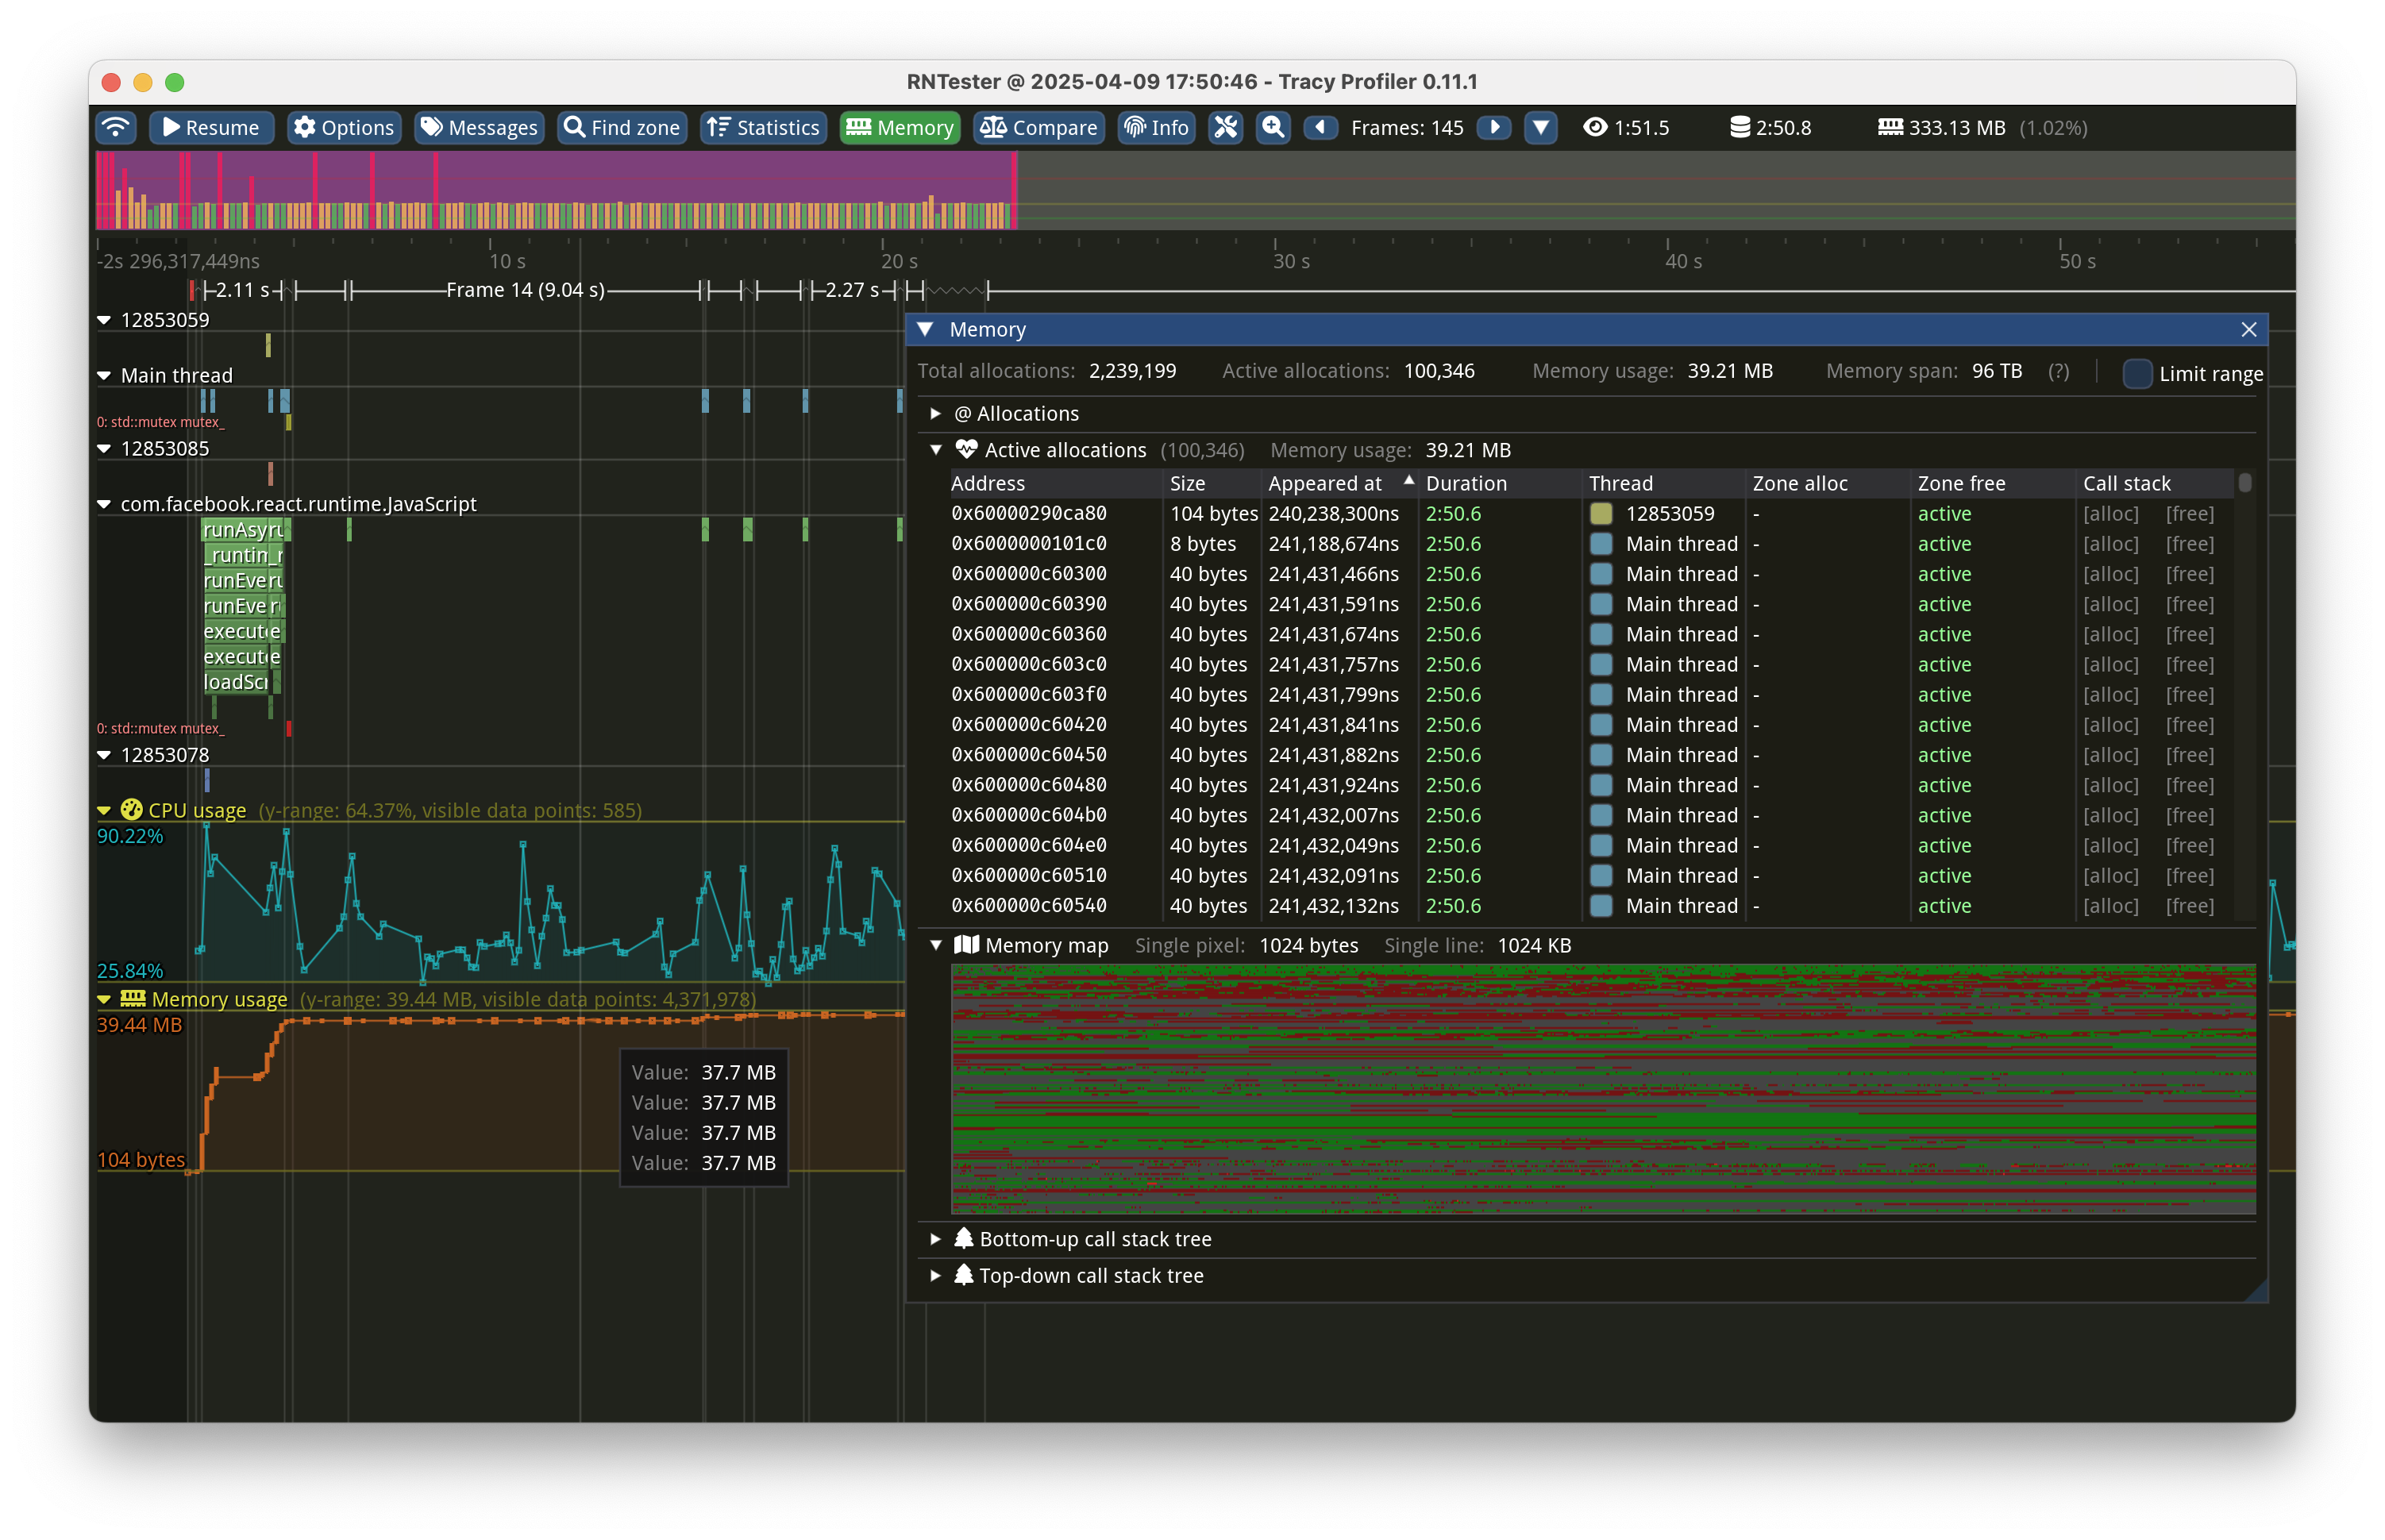
When this is active, Tracy's UI will display a timeline of memory usage and allow you to inspect every allocation that occurred during the program's execution.
Watch this segment of The Cherno's video where he uses Tracy to begin diagnosing performance issues in his game engine. It's a great real-world demonstration of launching Tracy and getting an initial read.
Performance Bottlenecks in My Game Engine
This video shows a developer's practical workflow, moving from simple built-in timers to a full-blown profiler like Tracy.
Watch from launching Tracy to see how it connects to a running application and immediately starts streaming data. Then, observe how he begins to dissect the information, identifying thread activity and zooming in on potential bottlenecks. Notice how the visual representation immediately points to areas of interest.
perf: The Linux Powerhouse
While Tracy is fantastic for interactive, instrumentation-based profiling, the world of performance analysis is vast. On Linux, one of the most powerful tools available is perf, which is part of the kernel itself. It is a sampling profiler and can provide deep insights into hardware-level events like cache misses and branch mispredictions, often with very low overhead.
Given your interest in systems programming, perf is an essential tool to have in your arsenal.
Comprehensive Guide to Using `perf` for C++ Applications
This guide provides an excellent, hands-on introduction to using perf for C++ applications.
First, read the sections on installing and configuring perf for your system. Then, focus on the two main workflows: perf stat for a quick overview, and the perf record/perf report cycle for identifying hotspots. Finally, see how perf can be used to analyze cache performance and how flame graphs can visualize the results.
The perf Workflow
Working with perf typically follows one of two paths.
1. Quick Overview with perf stat
The perf stat command runs your application and provides a summary of its performance, including key metrics like CPU cycles, instructions executed, and, crucially, cache performance.
# Compile with debug symbols for better function names
g++ -g -O2 my_app.cpp -o my_app


# Run the app under perf stat
perf stat ./my_app
The output will include a line for cache-misses. A high cache miss rate (e.g., >10%) is a strong indicator that your data structures or algorithms are not CPU-cache friendly, a topic we touched on in Module 6 (AoS vs. SoA). This gives you a high-level signal about your memory access patterns.
2. Finding Hotspots with perf record and perf report
This is the core workflow for identifying which functions are consuming the most CPU time.
-
perf record ./my_app: This runs your application and collects profiling samples, saving them to aperf.datafile. The application may run slightly slower, but this is the data collection phase. -
perf report: This command analyzes theperf.datafile and presents an interactive, sorted list of functions where the program spent its time.
The report will show you a percentage of total execution time for each function. The functions at the top of this list are your "hotspots"—the primary candidates for optimization.
Tracy vs. perf: Which to Use?
Both tools are exceptional, and they answer different questions.
| Feature | Tracy | perf (on Linux) |
|---|---|---|
| Profiling Type | Primarily instrumentation, with strong sampling support. | Primarily sampling. |
| Setup | Requires code integration (Tracy.hpp, TRACY_ENABLE). |
No code changes needed. Requires kernel support. |
| Interface | Real-time, interactive GUI. Highly visual. | Command-line interface. Text-based reports. |
| Primary Use Case | Analyzing frame-by-frame behavior, thread interaction, lock contention, and the flow of a complex application. | Identifying CPU hotspots, analyzing hardware events (cache/branch misses), and low-overhead production profiling. |
| Memory Analysis | Excellent for tracking individual heap allocations/deallocations and identifying leaks. | Less direct. Informs on memory performance via cache misses. |
For your whiteboard project, a good workflow would be:
- Use Tracy to get a visual understanding of your frame structure and identify any obvious stalls or long-running functions. Its memory profiler is excellent for finding leaks or suboptimal allocation patterns.
- Use
perfto get a low-level, hardware-centric view. It can reveal performance issues that Tracy might not, like poor cache locality that leads to high cache-miss rates across many small functions.
Conclusion
You now have a foundational understanding of how to use professional-grade profiling tools to measure the performance of your C++ application. This is the first and most critical step in any optimization effort.
Key Takeaways:
- Profiling is the process of measuring your application to find performance bottlenecks.
- Tracy is a modern, real-time visual profiler ideal for C++ graphical applications. It excels at showing frame-by-frame performance and memory allocations through code instrumentation.
perfis a powerful Linux command-line tool that uses sampling to identify CPU hotspots and analyze hardware performance counters like cache misses.- You can measure frame time by analyzing the execution time of functions within your main loop.
- You can measure memory allocations by tracking heap usage over time and inspecting individual allocation events.
In our final lesson, we will put this knowledge into practice. We will analyze a profiling report to identify and resolve a performance bottleneck, taking a piece of suboptimal code and making it measurably faster.