Welcome to the final lesson of your journey in building a high-performance whiteboard application. In our previous session, you learned how to equip your application with professional-grade profiling tools, Tracy and perf, to generate detailed performance data. You now know how to measure. Today, we close the loop by focusing on the most critical part of performance work: learning how to interpret that data.
This lesson's outcome is to analyze a profiling report to identify and resolve a performance bottleneck in the application. We will move from a mountain of data to a concrete, actionable insight. This is the detective work of systems programming—piecing together clues from profiler outputs to uncover the hidden inefficiencies in your code. Mastering this skill is the final step in transforming your functional application into one that is truly performant, a core goal of your project and a hallmark of expert low-level engineering.
The Profiling Mindset: From Measurement to Understanding
Before we dive into specific reports, it's crucial to adopt the right mindset. Performance work is not a series of random guesses; it's a scientific method. A profiler gives you evidence, but it's your job to form a hypothesis and test it. An excellent article, "The Art of Profiling C++ Applications," frames this discipline perfectly.
The Art of Profiling C++ Applications - SToFU Systems
This article provides the philosophical foundation for effective performance work. It's less about which buttons to click and more about how to think like a performance engineer.
Read the introduction to understand why profiling is a "discipline of honesty." Then, focus on the sections Profiling Begins Before the Tool Opens, which emphasizes asking precise questions, and Learn to Distinguish Work From Waiting, which introduces the single most important distinction in performance analysis.
The key takeaways from this reading should be:
- Ask a specific question. "Why is rendering a complex path slow?" is a better question than "Why is the app slow?"
- Measure under realistic conditions. Profile with the same build configuration (e.g., Release with debug info) and workloads that your users will experience.
- Distinguish CPU work from waiting. This is fundamental. Is your program slow because the CPU is busy with computations, or because it's idle, waiting for a lock, a network packet, or a disk read? A CPU profile can be dangerously misleading if the bottleneck is actually a "wait" state.
A Systematic Approach to Analyzing a Profiling Report
Let's imagine you've run your whiteboard application and captured a profile. You're now looking at a complex timeline or a long list of functions. Where do you start?
Step 1: The High-Level View – Work or Waiting?
Your first goal is to determine the nature of the slowness.
- In Tracy: Look at the main thread's timeline. Do you see long, solid blocks of color, indicating continuous CPU activity? Or are there gaps, or specific color-coded blocks indicating a wait on a lock or another thread?
- With
perf: Useperf stat. A high Instructions Per Cycle (IPC) count (e.g., > 1.0) often suggests the CPU is busy doing useful work. A very low IPC might hint that the CPU is stalled, often waiting for memory.
A classic "waiting" problem is lock contention. This happens when one thread tries to acquire a mutex that is already held by another thread. The first thread simply stops and waits.
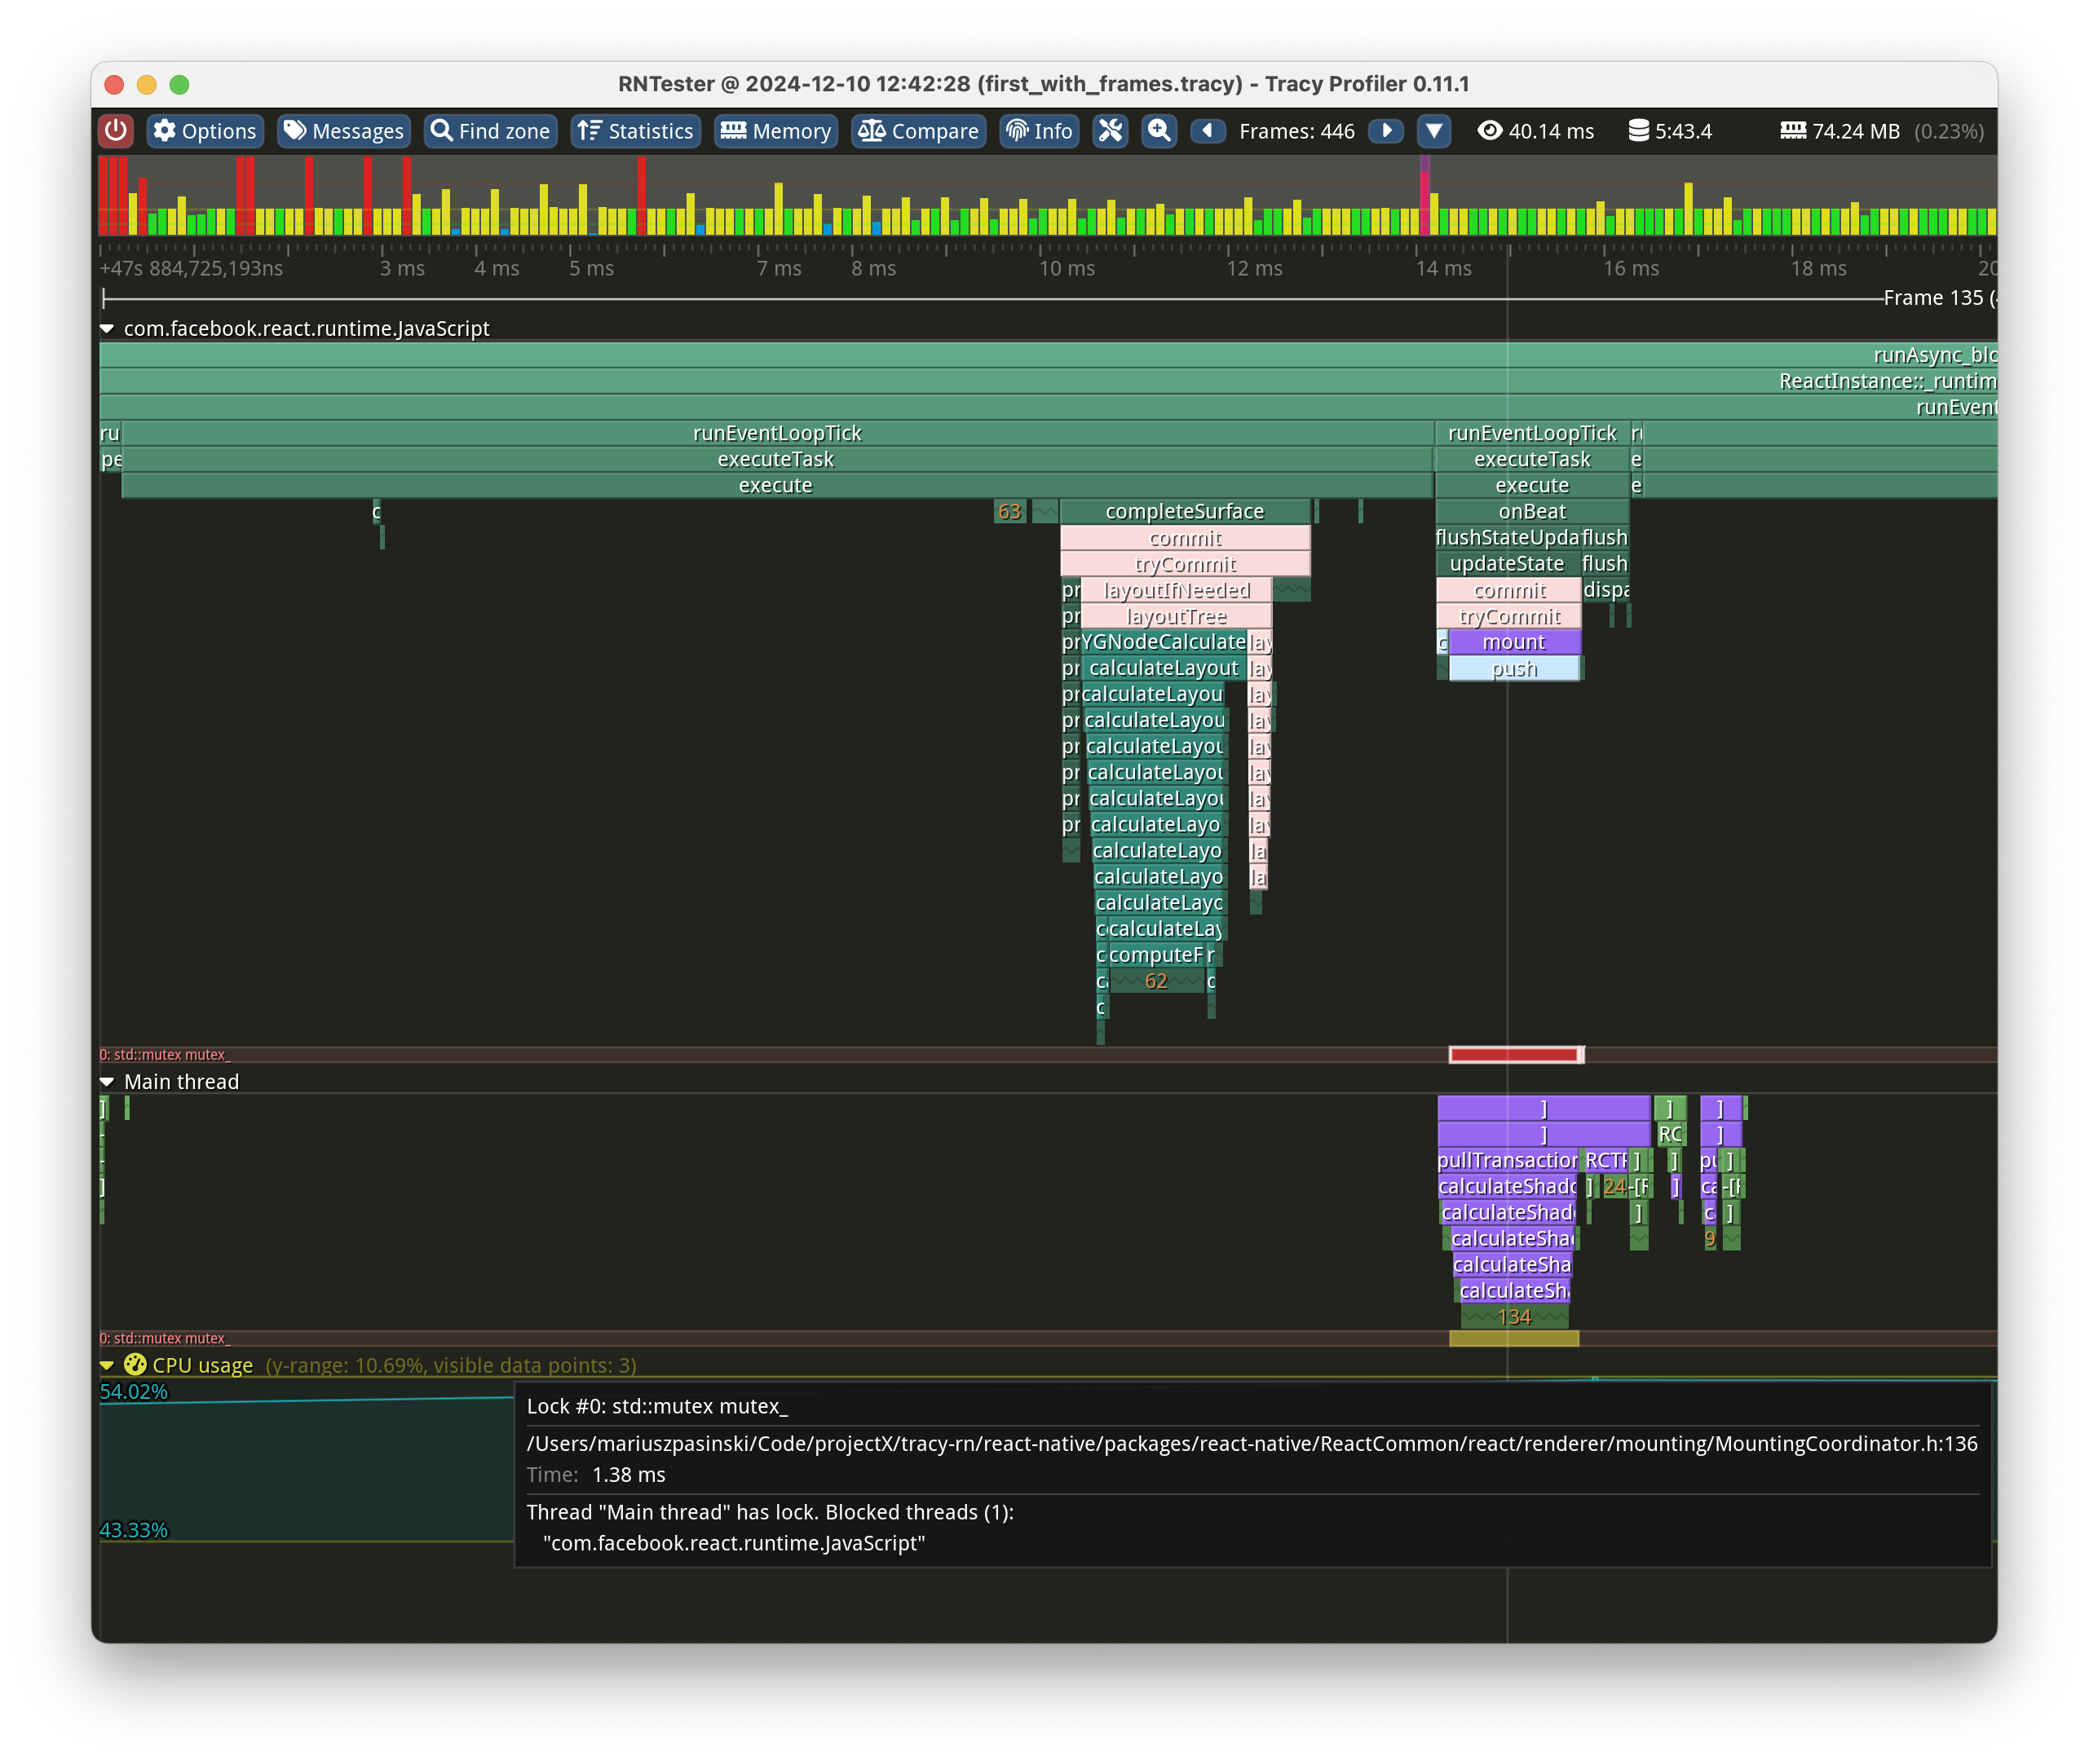
To diagnose these issues, you need a profiler that understands thread interactions. As we saw in the previous lesson and the CppCon talk on Tracy, tools designed for this can make these problems obvious.
An Introduction to Tracy Profiler in C++ - Marcos Slomp - CppCon 2023
Let's briefly revisit the section on lock contention from the Tracy introduction video.
Watch the segment from instrumenting and visualizing locks. Notice how the profiler explicitly shows which thread is blocking which, and for how long. This is how you identify a waiting problem.
If your application is spending most of its time waiting, optimizing the CPU-bound code is pointless. You must first fix the coordination problem (e.g., by reducing lock scope, using lock-free data structures, or redesigning the threading model).
Step 2: If CPU-Bound – Where's the Heat?
If you've determined your application is CPU-bound (the CPU is the bottleneck), the next step is to find the "hotspot"—the code that's consuming most of the CPU cycles.
- In Tracy: The "Statistics" view is your primary tool. It aggregates all the zone data and shows you the total time, average time, and number of calls for each instrumented zone. Sort by total time to find your biggest hotspots.
- With
perf: This is the primary purpose of theperf reportcommand. It presents a list of functions, sorted by the percentage of CPU time they consumed.

Step 3: Zooming In – Why Is the Hotspot Hot?
Once you've identified a function, you need to understand why it's slow. Is it a bad algorithm? Inefficient data access? A hardware-level issue?
This is where you drill down to the source or even assembly level.
- In Tracy: From the statistics view, you can jump directly to the source code of a zone.
- With
perf: Fromperf report, select the hotspot function and pressaforannotate. This will show you the function's source code or assembly, with the percentage of time spent on each line.
This is where deep performance insights are found. Often, the reason a line is "hot" is not obvious. The problem might not be the instruction itself, but its interaction with the CPU's architecture. A fantastic CppCon talk on high-frequency trading systems provides a perfect example.
When Nanoseconds Matter: Ultrafast Trading Systems in C++ - David Gross - CppCon 2024
This talk demonstrates a masterclass in performance analysis. The speaker uses perf to diagnose a subtle bottleneck in a std::vector-based data structure.
Watch the segment from profiling with perf. The speaker uses perf stat and the Intel Top-Down Microarchitecture Analysis methodology to identify that the bottleneck is "Bad Speculation." He then uses perf record to pinpoint the cause: two conditional jumps inside std::lower_bound. The CPU's branch predictor cannot effectively predict the outcome of these jumps, leading to pipeline stalls. This is a non-obvious bottleneck that can only be found with this level of analysis.
This example reveals a crucial principle: mechanical sympathy. The fastest code is often that which is in harmony with the underlying hardware. The branchless binary search in the video is faster not because it does less work (it actually does more!), but because it's more predictable for the CPU pipeline.
Step 4: Forming and Testing a Hypothesis
You now have all the clues. It's time to state your hypothesis and propose a fix.
- Hypothesis: "The
render_strokesfunction is slow because it's traversing astd::listof strokes, causing poor cache locality and frequent cache misses." - Hypothesis: "The order book update is slow because
std::lower_boundon a large vector suffers from high branch misprediction rates."
The final, non-negotiable step is to implement the fix and re-profile. Did the total time decrease? Did the hotspot move or disappear from the report? Did a new bottleneck emerge? Optimization is an iterative cycle: Analyze -> Hypothesize -> Fix -> Re-measure.
Hands-On Analysis: Deconstructing a Problematic Program
Let's apply this entire methodology to a concrete example. The "Art of Profiling" article provides a small C++ program with several intentional "performance smells."
The Art of Profiling C++ Applications - SToFU Systems
This part of the article contains the source code for our case study and a set of tasks.
Familiarize yourself with the main.cpp code. Identify the four "performance smells" the author points out: repeated string copies, needless sorting, central lock contention, and string allocations. Then, review the five test tasks. We will use these as our optimization roadmap.
Let's walk through the analysis and resolution process for this program.
The Program:
Two threads process a large vector of randomly generated strings. Each thread takes half of the input. For each string, it:
- Makes a copy (
auto copy = rows[i]). - Sorts the copy (
std::sort(copy.begin(), copy.end())). - Calculates a "score" from the sorted copy.
- Acquires a global lock (
std::lock_guard guard(g_lock)). - Pushes the score into a global output vector.
Profiling Analysis:
If we run perf record ./bad_profile and then perf report, we would expect to see the following hotspots:
- Lock Contention: Functions related to
std::mutex::lockandstd::mutex::unlockwould likely be very high on the list. The two threads are constantly fighting for a single, global lock to write their results. This is a classic "waiting" problem. - CPU Work:
std::sortwould appear as a major hotspot. We are sorting 400,000 strings for no good reason. - Memory Operations:
std::string's copy constructor and allocation functions would also be visible. The lineauto copy = rows[i];creates a new heap allocation and copies the string data in every iteration of the hot loop.
Resolution and Verification (Following the Test Tasks):
-
Hypothesis: The global mutex is causing massive contention, forcing threads to wait.
- Fix: Eliminate the global lock. Give each thread its own private
outvector. After the threads join, merge the two private vectors into the final result. - Verification: Re-profile. The lock-related symbols will vanish from the
perfreport. The application's total runtime will decrease, and it will scale better if you add more threads.
- Fix: Eliminate the global lock. Give each thread its own private
-
Hypothesis: The
std::sortcall is performing unnecessary, expensive work.- Fix: Comment out or delete the
std::sortline. - Verification: Re-profile.
std::sortis gone from the report. The runtime will drop dramatically. This highlights how a single line in a hot loop can dominate performance.
- Fix: Comment out or delete the
-
Hypothesis: The string copy
auto copy = rows[i];is causing excessive allocations and memory copies.- Fix: Since we need to modify the string for sorting, we can't just use a
const&. But if we've already removed the sort, and thescore_payloadfunction takes aconst std::string&, we can change the line toconst auto& copy = rows[i];and pass that toscore_payload. This avoids the copy entirely. - Verification: Re-profile. The time spent in
std::string's copy constructor will decrease. Tracy's memory profiler would show a massive reduction in allocation churn.
- Fix: Since we need to modify the string for sorting, we can't just use a
By following this evidence-based cycle, you've systematically dismantled each performance issue and verified its impact.
Conclusion
You have now reached the end of your formal training. You started by setting up a project, learned the intricacies of modern C++, built a rendering engine with Skia, handled user interaction, and implemented complex features like PDF parsing and document export. Today, you've learned the capstone skill: how to scientifically analyze and improve your application's performance.
Key Takeaways:
- Performance analysis is a systematic cycle: Analyze -> Hypothesize -> Fix -> Re-measure.
- The first step is always to determine if a bottleneck is CPU-bound (work) or a coordination/IO issue (waiting).
- Use profiler reports to find hotspots (functions consuming the most time) and then annotate to drill down to the specific lines or instructions causing the issue.
- True optimization often requires mechanical sympathy—understanding how your code interacts with the hardware (caches, branch predictors) and choosing algorithms and data structures accordingly.
- Never assume. Always measure. A profiler report is the evidence that guides your work and settles arguments.
Your final task is to apply these very principles to your own whiteboard application. Use Tracy and perf to find its true bottlenecks. Is it slow because of inefficient stroke rendering? Poor data structures for your spatial index? Contention during asynchronous PDF parsing? Let the data guide you to create a final product that is not only feature-complete but also impressively fast and efficient.