Introduction
In the previous lesson, you mastered the critical skill of debugging deployments by inspecting server logs. With those potential startup errors resolved, your application should now be successfully deployed and running on your hosting provider's servers.
This lesson is the moment of truth. We will confirm that your hard work has paid off by verifying that your API is not just running, but is fully operational and accessible to the public internet. Specifically, you will verify that the live API is responsive and that your Swagger documentation is accessible at its designated URL. This step is the final validation before you package your project for submission.
Finding Your Live Application URL
After a successful deployment, your hosting service (like Render or Railway) assigns your application a unique, public URL. This is the base address for your live API.
Your primary task is to locate this URL in your hosting provider's dashboard. It is typically displayed prominently on the service's main page.
- On Render, it will look like
https://your-service-name.onrender.com. - On Railway, it might be
https://your-service-name.up.railway.app.
The following video quickly demonstrates where to find this link on Render after a deployment goes live.
How to Deploy a Node/Express App to Render | Node/Express Render Deployment
Watch this brief clip to see exactly where to find your live application's URL on the Render dashboard once the deployment is complete.
Watch from 05:53 to 06:37. The key is to look for the message 'Your service is live' and the clickable URL provided near the top of the page.
If you are using Railway, the process is just as straightforward. After deploying from GitHub, you navigate to your project's Settings tab and click Generate Domain to get your public URL.

Step 1: Verify the API is Operational
Once you have your live URL, the first test is to see if the server responds to requests.
- Open the base URL in your web browser (e.g.,
https://my-cool-api.onrender.com). - Observe the response. There are two likely outcomes, and both indicate success:
- Success Scenario A: You see a message like "API is running...". This happens if you created a basic
GETroute for the root path (/). - Success Scenario B: You see a JSON error message like
{"message": "Cannot GET /"}. This is also a great sign! It means your Express server is running, and your 404 "not found" handler is correctly catching requests for undefined routes.
- Success Scenario A: You see a message like "API is running...". This happens if you created a basic
A failure at this stage would be a browser error like "This site can’t be reached" or a generic error page from your hosting provider. If you see that, it means your server has crashed. You must return to the previous lesson's topic: open your server logs and debug the startup error.
Step 2: Verify the Swagger Documentation
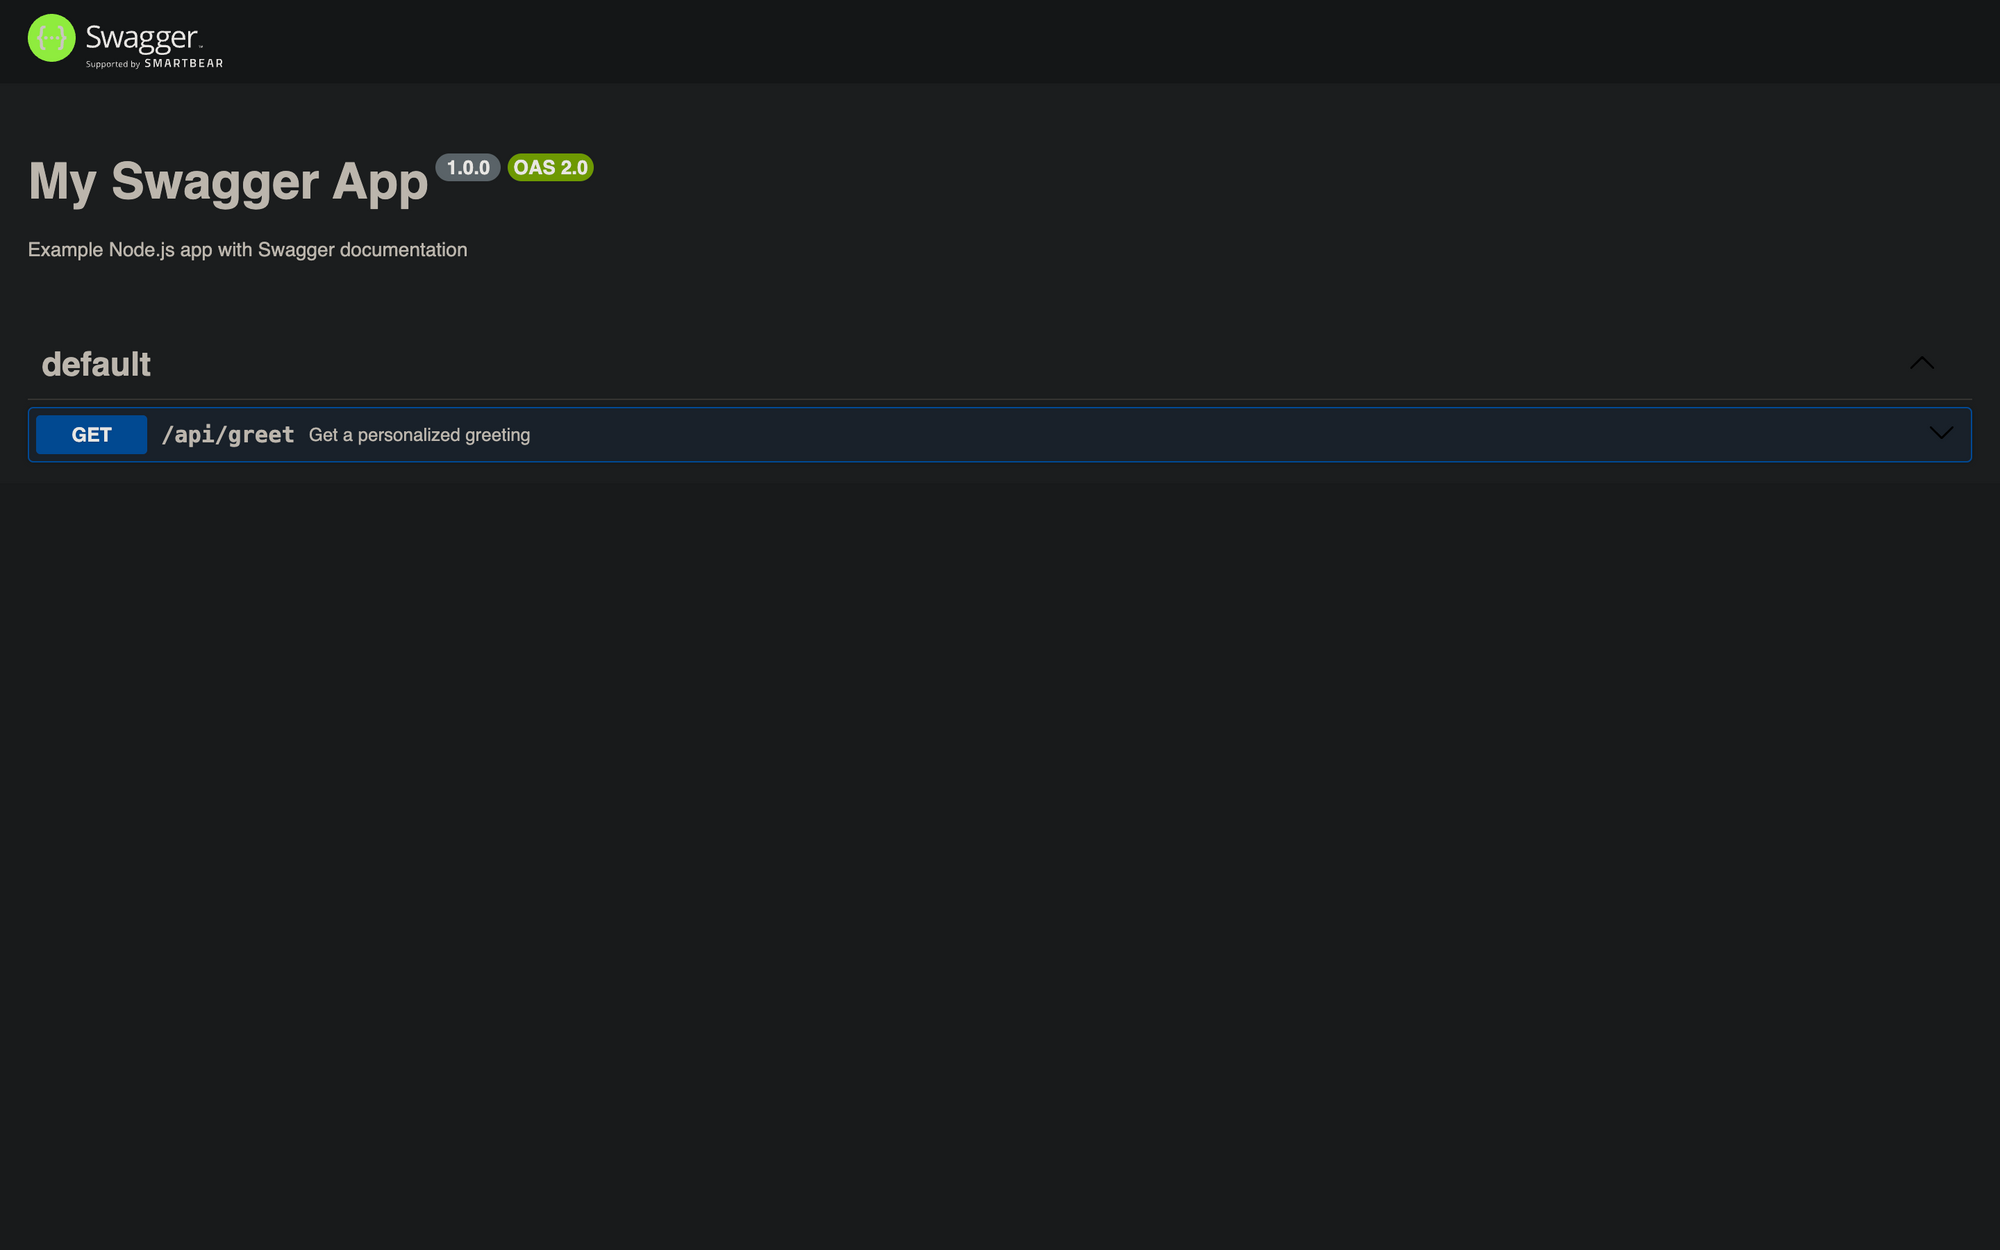
With the server confirmed to be live, the next critical check is your API documentation. For the exam, providing a working link to your interactive Swagger documentation is mandatory.
- Take your base URL and append the path you used for your Swagger UI. By convention, this is
/api-docs. The full URL will be something likehttps://my-cool-api.onrender.com/api-docs. - Open this full URL in your browser.
You should see the Swagger UI interface load, displaying all the endpoints you have documented. It should look similar to this:
What to Do If It Doesn't Work
If your /api-docs page fails to load, use this checklist to diagnose the problem:
-
Problem: You get a
404 Not Founderror (from your own API, not the hosting provider).- Cause: The path in your
app.jsorserver.jsmight be incorrect. Double-check your Swagger setup code:app.use('/api-docs', swaggerUi.serve, swaggerUi.setup(specs));. Ensure the path/api-docsmatches what you are trying to access. - Fix: Correct the path in your code, commit, and push to redeploy.
- Cause: The path in your
-
Problem: The Swagger page loads but is empty or shows a "Failed to load API definition" error.
- Cause 1: There is a syntax error in your JSDoc/YAML comments. YAML is extremely sensitive to indentation. A single misplaced space can break the entire parser.
- Cause 2: The
swagger-jsdocoptions object is not correctly pointing to your route files. Check theapisarray in your configuration (e.g.,apis: ['./routes/*.js']). - Fix: Carefully inspect your JSDoc comments for any YAML indentation errors. Then, check the deployment logs.
swagger-jsdocmay print parsing errors to the console, which will point you to the exact file and line causing the issue. Correct the error, commit, and push.
Verifying your Swagger documentation is not just about ticking a box; it confirms that your API is well-documented and ready for others (including exam graders) to review and interact with.
Conclusion
You have now reached the final milestone of the development and deployment process. By confirming that your API is live and your Swagger documentation is accessible, you've validated that the entire stack—from your code and environment variables to the hosting platform's configuration—is working in harmony.
Key Takeaways:
- Your live application is accessible via a unique URL provided by your hosting platform (e.g.,
...onrender.com). - Verifying the API is operational can be as simple as loading the base URL. A
404 Not Foundresponse from your own server is a positive sign. - The Swagger documentation must be accessible at its designated endpoint (e.g.,
/api-docs). This is a non-negotiable requirement. - If verification fails, systematically debug the issue by checking server logs for crashes or looking for configuration errors in your Swagger setup and JSDoc comments.
Next Up:
With a fully deployed and verified application, you are on the home stretch. The final lesson will guide you through the process of final review and submission packaging. You will learn how to clean up your project, perform a final status code check, and assemble all the required artifacts—the ZIP file, live links, GitHub repo, and Postman collection—to ensure a perfect submission.