Introduction
Welcome back! In our last lesson, you learned the clever mechanics behind traceroute/tracert. You now know how it uses the IP packet's Time-To-Live (TTL) field to discover the sequence of routers, or "hops," between you and a destination. You ran the command and saw the raw output.
Today, we'll focus on the next crucial step: interpretation. A traceroute output is a story about a packet's journey, and this lesson will teach you how to read it. We will dissect the output column by column and, most importantly, learn to identify the tell-tale signs of network performance issues by analyzing latency patterns and understanding what timeouts (* * *) really mean. This is a fundamental skill for any network diagnostician, directly bridging your "book knowledge" of routing with real-world problem-solving.
1. Anatomy of a Traceroute Result
Let's start by breaking down a typical traceroute output. In the previous lesson, you ran tracert google.com (or traceroute on macOS/Linux). Run it again now and let's examine the output together. It should look something like this:
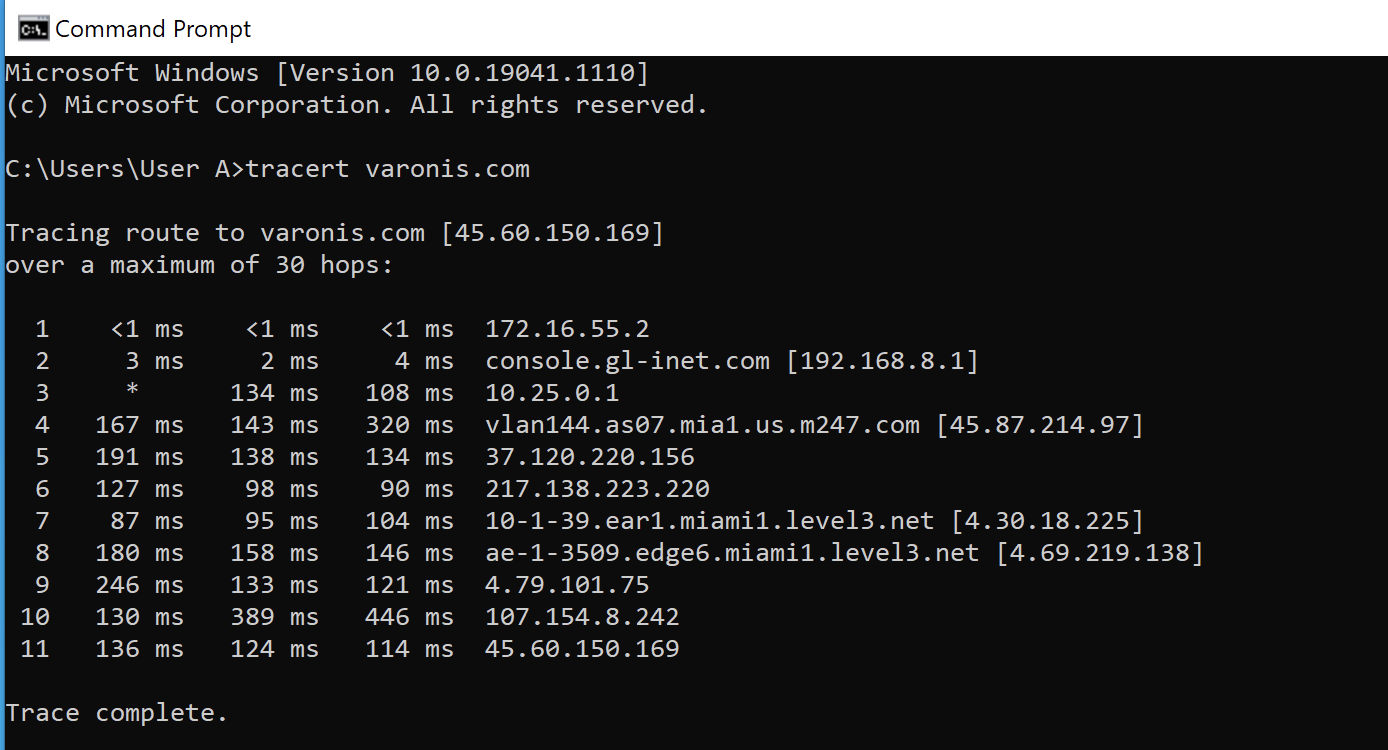
Each row represents one hop and is typically divided into five columns.
This brief guide from ResRequest provides an excellent breakdown of the columns in a traceroute report. It will serve as our reference for this section.
Read the section 'How to read a Traceroute' down to (but not including) 'Checking the hop times'. Focus on the table that defines each of the five columns.
Based on that reading, let's summarize:
- Hop Number: The first column simply shows the sequential number of the router in the path. Hop 1 is your first router, hop 2 is the next one, and so on.
- Round-Trip Time (RTT): The next three columns show the latency, in milliseconds (ms), for a packet to travel from your computer to that hop and back again. By default,
traceroutesends three probe packets to each hop to check for consistency. This is the most important data for judging network performance. - Name/IP Address: The final column shows the IP address of the router at that hop. If possible,
traceroutealso performs a reverse DNS lookup to show a hostname, which can often give you clues about the router's location or owner (e.g.,core1.nyc4.he.netsuggests a core router in New York City owned by Hurricane Electric).
The following video provides a great visual walkthrough of this same information.
Traceroute Explained | Real World Examples
To see this explained with a live demonstration, watch this segment from CertBros.
Watch from 2:38 to 4:38. The presenter clearly explains what each column in the tracert output represents.
2. Interpreting Latency Patterns
Now for the core of the analysis: what do the RTT numbers tell you? High latency (long delays) can cause slow-loading websites, buffering video, and lag in online games. Traceroute helps you find where that latency is coming from.
It's crucial to understand that not all high latency is a sign of a problem. The key is to look for patterns.
The ResRequest article we looked at earlier has an excellent guide for interpreting different latency patterns. Let's read through the common scenarios.
Read the subsections from 'Checking the hop times' through 'High latency in the beginning hops'. Pay close attention to the difference between a latency spike that recovers versus one that persists or keeps growing.
Let's summarize those key patterns:
- Low and Consistent Latency: The first few hops (within your local network and your ISP's network) should have very low RTTs (typically <10-20 ms).
- Sudden Jump, then Stays High: If latency jumps at a certain hop and stays high for all subsequent hops, it often indicates a significant geographical distance has been crossed (e.g., a transatlantic fiber cable). This is normal.
- A Single High-Latency Hop: If one hop shows high latency, but the next hop's latency drops back down, it's usually not a problem. This often means the router at that hop is busy and de-prioritizes responding to
traceroutepackets, but it is still forwarding traffic efficiently. - Steadily Increasing Latency / Packet Loss: This is the pattern to watch for. If latency jumps at a hop and continues to get worse and worse at every subsequent hop, or if you start seeing timeouts (
*), it points to a congested or faulty router. The problem likely begins at the hop where the latency first spiked.
The video below demonstrates how to use traceroute to spot a latency bottleneck.
Traceroute Explained | Real World Examples
Let's see a practical example of looking for latency issues.
Watch from 9:56 to 11:10. The presenter explains how you would identify a hop with an unusually large RTT that could be the source of a bottleneck.
3. Understanding Timeouts and Failures
What does it mean when you see a row of asterisks (* * *)? This is a timeout. It means your computer sent out its three probe packets but did not receive a response from that hop's router within the allowed time.
Like high latency, timeouts are not always a sign of a critical failure. Context is everything.
Traceroute Explained | Real World Examples
First, let's get a basic understanding of what a 'Request timed out' message signifies.
Watch from 7:53 to 8:14. This short clip explains the most common reason for a timeout in the middle of a trace.
As the video explains, a common reason for a timeout is that a router is configured (often for security reasons) to not send the ICMP "Time Exceeded" messages that traceroute relies on.
Let's explore the different timeout scenarios:
- Timeouts in the Middle: If you see timeouts at one hop, but the trace picks back up and completes, it's almost certainly a router that is intentionally not responding. You can safely ignore this.
- Timeouts at the End: If the trace runs through several hops and then times out for every hop until the end, it could mean several things:
- The destination server's firewall is blocking the incoming
traceroutepackets. - The packets are reaching the destination, but a firewall or routing issue is blocking the replies on the return path.
- There is a genuine connectivity failure at the last responding router.
- The destination server's firewall is blocking the incoming
- Timeouts from the Start: If you can't even get past the first or second hop, this often points to a local issue: your own computer's firewall, a problem with your router, or an issue at your ISP.
Traceroute is a powerful troubleshooting tool. When you can't reach a server, running a traceroute can tell you where the connection is failing.
Traceroute - NetworkLessons.com
This article from NetworkLessons.com has an excellent troubleshooting section that shows how traceroute output changes as a routing problem is fixed. This is a great way to see interpretation in action.
Read the section titled 'Troubleshooting', focusing on the first example, 'Destination Unreachable'. Notice how the output (with its asterisks) changes as the administrator fixes the routing hop-by-hop.
Conclusion
You can now not only generate a traceroute but also interpret the story it tells. You've learned to analyze the path, latency, and errors to form a diagnosis of network behavior.
Key Takeaways:
- Hops: Each line represents a router on the path to the destination.
- Latency (RTT): The three time columns are your primary indicator of performance. Look for patterns, not just single high numbers. A sudden jump that persists indicates distance; a spike that recovers is usually fine; a spike that leads to more latency or timeouts indicates a problem.
- Timeouts (
*): These mean a router didn't reply. Timeouts in the middle of a successful trace are common and can be ignored. Consistent timeouts that don't recover point to a routing issue or a firewall blocking the packets.
Preview of the Next Lesson:
Throughout our exploration of local networks and internet routing, we've repeatedly mentioned devices like hubs, switches, and routers. In our next lesson, we will formally distinguish the roles and operating layers of hubs, switches, and routers, clarifying exactly what each device does and where it fits in the TCP/IP model. This will solidify your understanding of the hardware that makes up the network paths you've just learned to trace.