Introduction
Hello! In our recent lessons, we've built a solid theoretical foundation for the Transport Layer, contrasting the reliable, connection-oriented nature of TCP with the fast, connectionless approach of UDP. You learned about the TCP lifecycle, including the handshake for establishment, the states for data transfer, and the sequence for termination.
This lesson bridges that theory with practice. We'll explore the netstat (network statistics) command-line utility, a powerful tool that comes with your operating system. It allows you to peer "under the hood" and see the very connections we've been discussing in real time. You will learn how to list active connections, see which applications are making them, and, most importantly, identify the current state of those TCP connections, directly linking the concepts you've learned to live network activity on your own machine.
1. What is netstat?
netstat is a command-line tool used to display network connections for TCP (both incoming and outgoing), routing tables, and a number of network interface and network protocol statistics. It's a standard utility available on Windows, macOS, and Linux, making it a versatile first stop for network diagnostics.
Let's begin with a clear, animated overview of what netstat does and how to use its most common options.
This video from PowerCert Animated Videos provides an excellent introduction to the netstat command and its purpose.
Watch from the beginning to 04:10. Pay close attention to: The basic netstat output and its columns. The purpose of the -n switch (showing numbers) and why it's faster. The purpose of the -a switch (showing all connections, including those in the 'LISTENING' state).
2. Decoding netstat Output
As you saw in the video, running netstat displays a list of active connections with several columns. Let's formally define the most important ones.
| Header | Description |
|---|---|
| Proto | The protocol used by the connection, usually TCP or UDP. |
| Local Address | The IP address and port number on your computer. 0.0.0.0 or [::] means the port is listening on all available network interfaces. |
| Foreign Address | The IP address and port number of the remote computer. An asterisk (*.* or *:*) means no connection is established yet. |
| State | The state of a TCP socket. This is the most important column for our lesson today! For UDP, this column is usually blank. |
3. Useful netstat Options
While netstat by itself is useful, its real power comes from combining it with options (or "switches") to filter the output. Since you have a computer science background, you'll find these options similar to flags used with other command-line tools like gcc or ls.
Here are some of the most common and useful options:
| Option (Flag) | Description |
|---|---|
-a |
Displays all active connections and listening ports. Without this, netstat might only show established connections. |
-n |
Displays addresses and port numbers in numerical form, skipping DNS name resolution. This is much faster. |
-p |
(Linux/macOS) Shows the Process ID (PID) and name of the program associated with the socket. Requires sudo. |
-b |
(Windows) Shows the executable name (binary) involved in creating the connection. Requires admin privileges. |
-o |
(Windows) Shows the owning process ID (PID) associated with each connection. |
Common Combinations:
netstat -an: This is a go-to command for a quick, comprehensive, and fast overview of all connections and listening ports.sudo netstat -anp: (On Linux/macOS) The "detective" command. It shows you everything numerically (-an) and tells you exactly which program is responsible for each connection (-p).netstat -anb: (On Windows) The equivalent detective command for Windows.
4. Understanding TCP Connection States
The State column in netstat's output is where our theoretical knowledge of the TCP lifecycle becomes tangible. When you see a state, it's a snapshot of where that connection is in its lifecycle.
Let's revisit the TCP state diagram to see the complete picture. All the states you see in netstat come from this process.
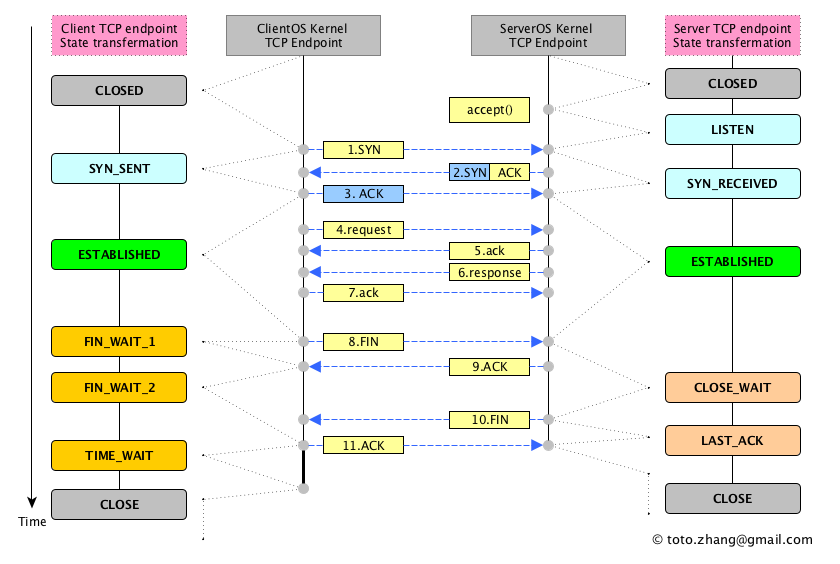
Here are the most common states you will encounter and what they mean:
LISTEN: A server application is waiting for new connection requests on a specific port. For example, a web server will be in theLISTENstate on port 443. This corresponds to a program having calledbind()andlisten()in socket programming.ESTABLISHED: The three-way handshake is complete, and a connection is active. This is the state where data is being transferred, for example, while you are browsing a webpage.CLOSE_WAIT: The remote end of the connection has sent aFINpacket, indicating it's done sending data. Your machine has acknowledged it and is now waiting for the local application to close the connection from its side. You might see this briefly if a server closes a connection before your browser does.TIME_WAIT: Your end initiated the connection closure. The socket is kept in this state for a short period after closing to ensure any delayed packets from the old connection are handled correctly. This is a normal and healthy part of the TCP termination process.
Let's look at a real-world example.

5. Hands-On Practice
Now it's your turn to be the detective. Let's connect the dots on your own machine.
- Prepare your environment: Close any unnecessary applications, but keep a single web browser window open.
- Generate some traffic: In your browser, open tabs for two or three different websites (e.g., your school's homepage, a news site, etc.). These will primarily use HTTPS, which runs over TCP on port 443.
- Run
netstat: Open your command prompt (on Windows) or terminal (on Linux/macOS).- Type
netstat -anand press Enter. - Look through the output. Can you find rows where the
ProtoisTCPand theStateisESTABLISHED? - In those rows, look at the
Foreign Address. You should see IP addresses followed by:443. These are your connections to the web servers.
- Type
- Identify the program:
- On Windows: Run
netstat -anb. (You may need to run Command Prompt as Administrator). Now, look at the same connections. Below each one, you should see the name of the program that created it, likelychrome.exe,firefox.exe, or similar. - On Linux/macOS: Run
sudo netstat -anp. You'll be prompted for your password. The last column will show you the PID and program name (e.g.,12345/firefox).
- On Windows: Run
- Observe a state change:
- Close one of the browser tabs you opened.
- Immediately re-run the same
netstatcommand from step 4. - Can you find the connection that was previously
ESTABLISHED? It may have disappeared, or you might catch it in theTIME_WAITstate for a brief period before it vanishes completely. This demonstrates the connection termination process in action.
Conclusion
Congratulations! You've successfully used netstat to monitor your computer's live network connections and map them directly to the theoretical TCP states we've studied. This is a fundamental skill for any developer or system administrator when it comes to network troubleshooting.
Key Takeaways:
netstatis a command-line tool for viewing network statistics.- The
-a(all),-n(numeric), and-p/-b(program) options are essential for getting a clear picture of network activity. - The
Statecolumn in the output shows the real-time status of a TCP connection (e.g.,LISTEN,ESTABLISHED,TIME_WAIT). - By using
netstat, you can identify which applications on your machine are communicating over the network and with whom.
Preview of the Next Lesson:
In this lesson, we saw the status of a connection. In the next one, we'll go a level deeper using another powerful tool: Wireshark. Instead of just seeing that a connection is ESTABLISHED, you'll capture and inspect the actual SYN, SYN-ACK, and ACK packets that make up the TCP three-way handshake. This will give you a packet-by-packet view of how connections are born.