Hello! Welcome back to our module on Monitoring, Optimization, and Troubleshooting.
In our last lesson, we focused on setting up CloudWatch Alarms to get notified when something goes wrong in our data pipelines. An alarm is a critical first step, but it's only half the story. Once an alarm fires, the real work of a data engineer begins: digging into the details to understand what happened and why.
This lesson directly addresses that need and covers the learning outcome: Implement CloudWatch Logs Insights queries for troubleshooting ETL and data processing failures.
Given your daily use of CloudWatch Logs, you're already familiar with the basics of log inspection. Today, we'll supercharge that skill with CloudWatch Logs Insights, a powerful query engine that allows you to interactively search and analyze terabytes of log data in seconds. This is an indispensable tool for diagnosing complex failures in distributed systems like AWS Glue and Lambda, where logs can be spread across hundreds of streams.
1. From Log Browsing to Log Analytics
You know that services like AWS Lambda or AWS Glue can generate numerous log streams—one for each concurrent Lambda instance or Glue worker. When troubleshooting, sifting through these streams one by one is inefficient and often impossible under time pressure.
This is the problem CloudWatch Logs Insights solves. It provides a purpose-built query language to analyze entire log groups at once.
To get a feel for the service and its core capabilities, let's start with a foundational video from AWS.
Analyze Log Data with CloudWatch Logs Insights
This official AWS video, 'Analyze Log Data with CloudWatch Logs Insights,' provides an excellent tour of the service. It covers the interface, basic query execution, and the main components of the query language.
Please watch from 02:19 to 04:22. As you watch, focus on: How to select a log group and a time range. The basic structure of a query, which uses a pipe (|) character to chain commands. The key commands mentioned: filter, stats (for aggregation), sort, limit, and parse.
The query language is the heart of Logs Insights. Its syntax is straightforward and powerful, typically following this pattern:
source log events | command1 | command2 | ...
Let's break down the most common commands you'll use:
fields: Specifies which fields to display in the query results. By default,@timestampand@messageare shown.filter: Filters results based on one or more conditions. This is your primary tool for narrowing down the search space (e.g.,filter @message like /ERROR/).stats: Calculates aggregate statistics, likecount(),avg(),sum(),min(), andmax(). This is incredibly useful for summarizing data.sort: Sorts the results in ascending (asc) or descending (desc) order.limit: Restricts the number of log events returned.parse: Extracts data from a log field, creating one or more ephemeral fields that you can use in your query. This is the key to turning unstructured log text into structured, queryable data.
2. Practical Troubleshooting: Investigating a Failing Glue Job
Now, let's apply these concepts to a scenario you're likely to face on the job and in the exam: a slow or failing AWS Glue ETL job. When a Glue job runs, its logs (from the driver and executors) are sent to a CloudWatch log group, typically /aws-glue/jobs/output and /aws-glue/jobs/error.
The following AWS blog post provides a fantastic walkthrough of using Logs Insights to diagnose common Glue job issues.
Troubleshooting AWS Glue ETL Jobs using Amazon ...
We will now dive into the blog post 'Troubleshooting AWS Glue ETL Jobs using Amazon CloudWatch Logs Insights enhanced queries'. This article contains practical, copy-paste-ready queries that demonstrate how to pinpoint inefficiencies and performance bottlenecks.
First, read 'Step 1: Setting Up Log Collection' to understand the prerequisite. Then, carefully study the queries in 'Step 2: Querying for Inefficiencies' and 'Step 3: Pinning Down Performance Bottlenecks'. For each query, try to understand: What is the goal of the query? How does the parse command extract the necessary information from the @message field? How does the stats command help summarize the findings?
Let's deconstruct one of the queries from that article to solidify the concepts.
Goal: Find the average and maximum execution time for each Glue job run to identify jobs that are inconsistent or have outlier long runs.
fields @timestamp, @message, @logStream as JobRun
| filter @message like /committed/
| parse @message /Job (?<jobNumber>\d+) finished:.*?, took (?<executionTime_inSeconds>\S+) s/
| parse @message /Write Job (?<jobId>[a-f0-9\-]+) committed\./
| stats avg(executionTime_inSeconds) as AvgDuration, max(executionTime_inSeconds) as MaxDuration by JobRun
| fields MaxDuration - AvgDuration as difference
| sort difference desc
How it works:
filter @message like /committed/: Narrows the search to only the log lines that indicate a job has finished and committed its output.parse @message ...: This is the magic. It uses regular expressions to find specific patterns in the completion message and extract theexecutionTime_inSecondsinto a new, temporary field.stats avg(...) as AvgDuration, max(...) as MaxDuration by JobRun: For each uniqueJobRun(log stream), it calculates the average and maximum of theexecutionTime_inSecondsfield we just extracted.fields MaxDuration - AvgDuration as difference: It then calculates the difference between the max and average duration, which is a great indicator of performance variability.sort difference desc: Finally, it sorts the results to bring the job runs with the highest variability to the top.
This single query transforms thousands of raw log lines into a concise, actionable report on job performance. This is the power of Logs Insights.
3. Expanding Your Troubleshooting Toolkit
The techniques for querying Glue logs are broadly applicable. You can use the same filter | parse | stats pattern to troubleshoot any component in your data architecture.
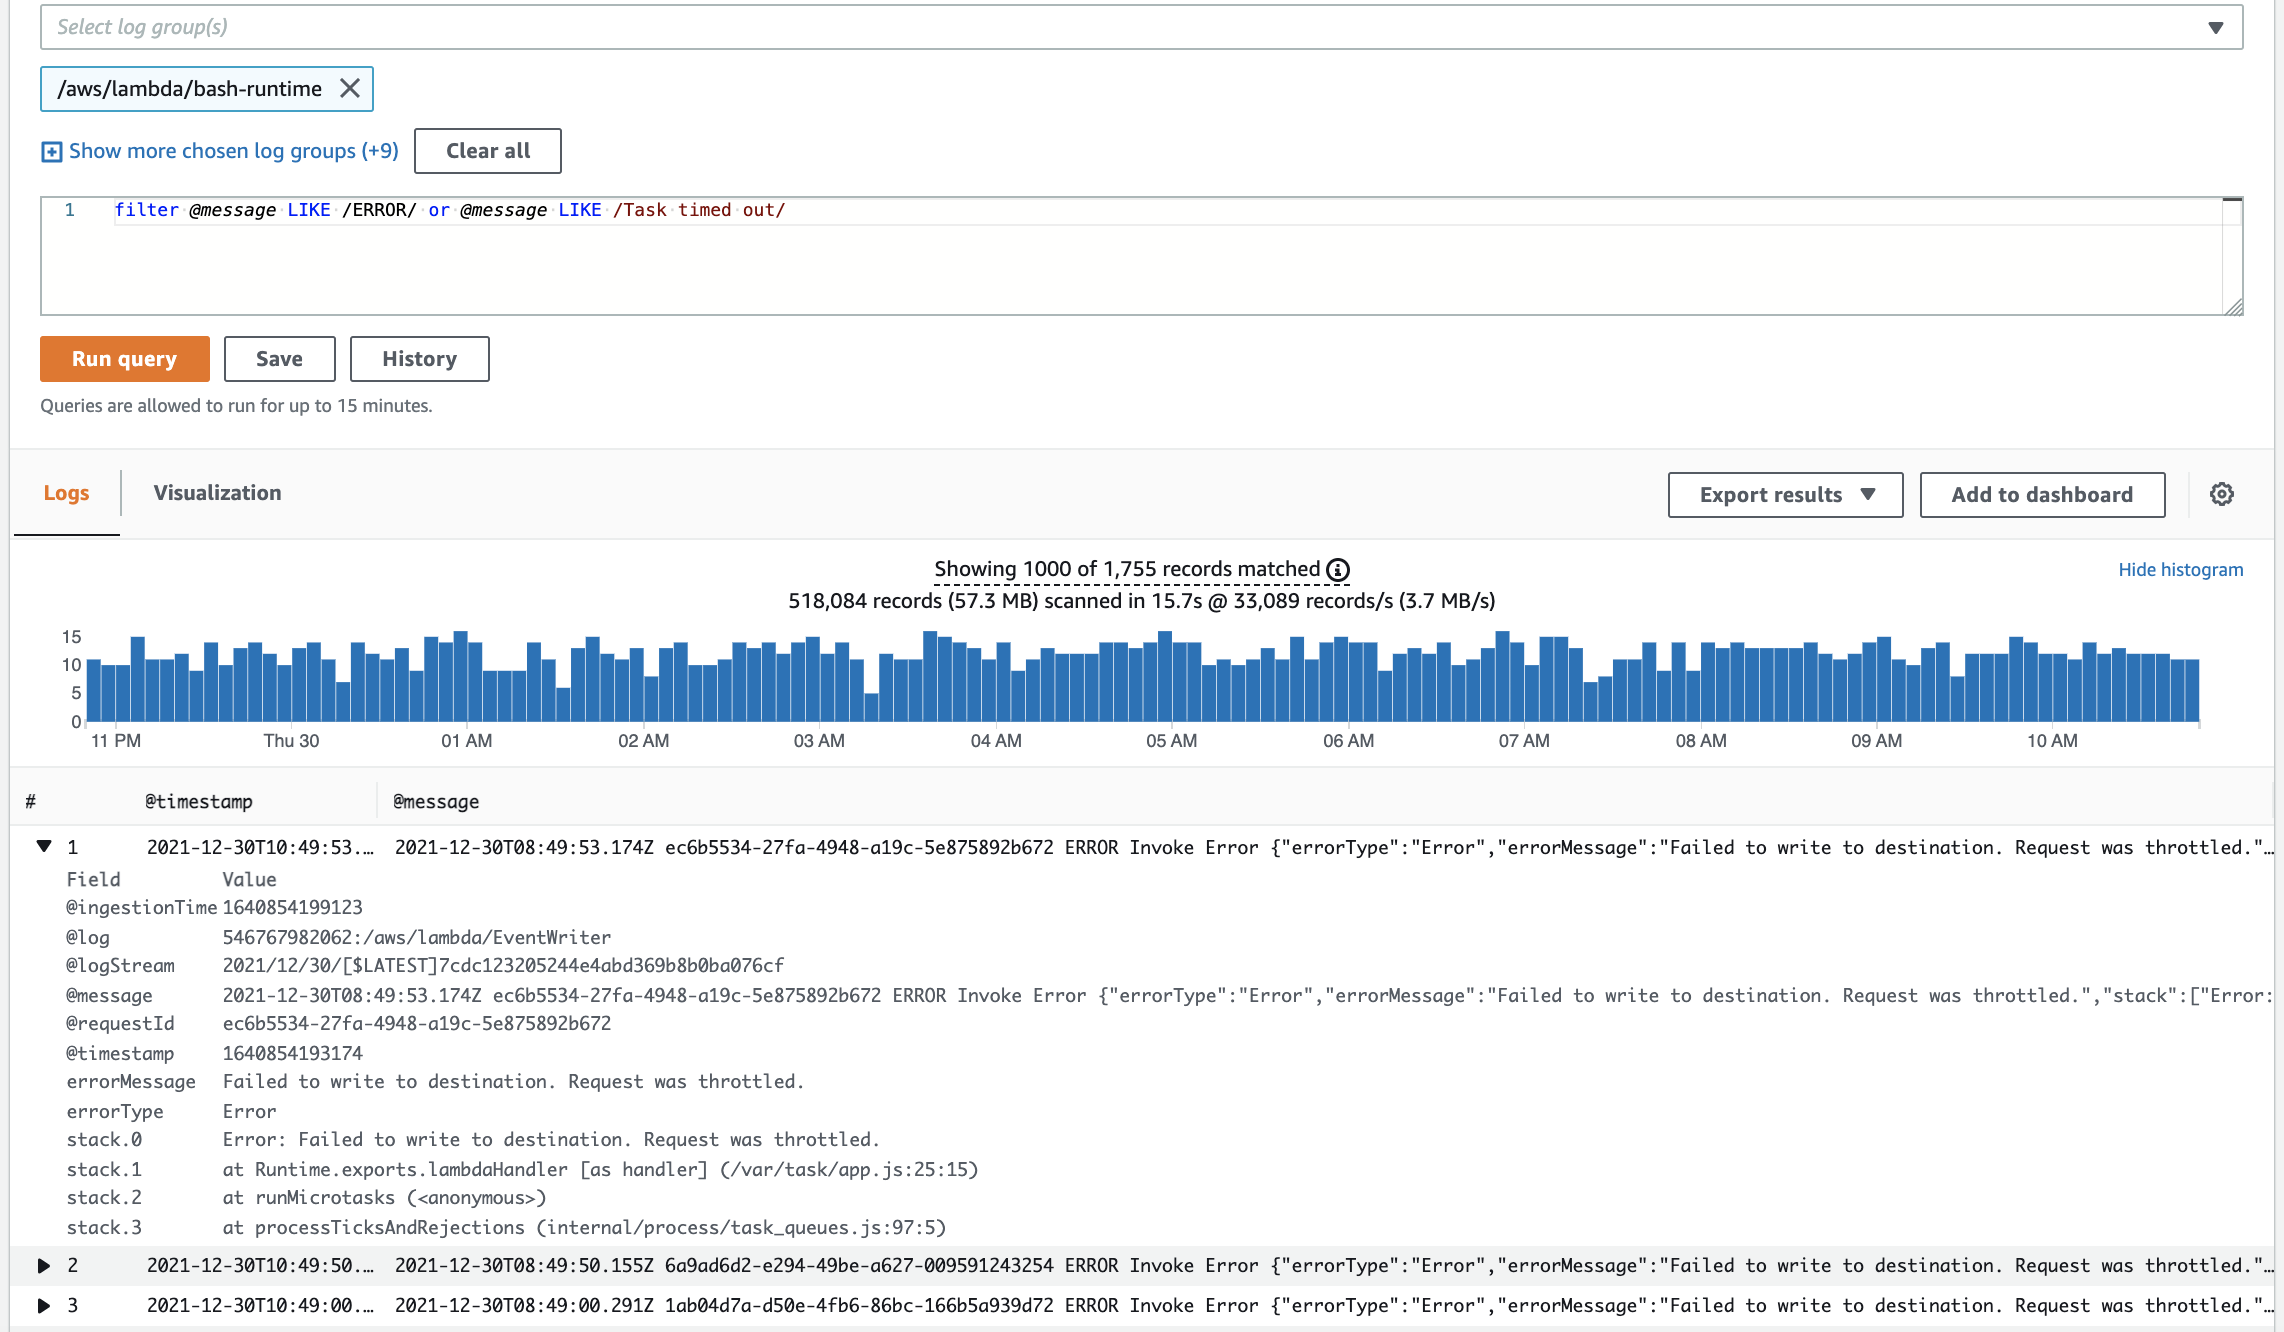
The image below shows a query that filters for Lambda function errors or timeouts, a common task when troubleshooting a serverless processing stage.
To become proficient, it's useful to have a mental library of query patterns for different services.
Sample queries - Amazon CloudWatch Logs
The official AWS documentation 'Sample queries - Amazon CloudWatch Logs' is an excellent resource for this. It's a cookbook of queries for many AWS services.
Scan through the 'General queries', 'Queries for Lambda logs', and 'Queries for CloudTrail logs' sections. You don't need to memorize them all, but pay attention to the patterns used to solve common problems.
Here are two key examples adapted from that documentation that are highly relevant for data engineering:
Example 1: Analyzing Lambda Performance
If your data pipeline uses Lambda functions, you need to monitor their performance. The REPORT line logged at the end of every Lambda invocation contains valuable metrics.
Goal: Get a latency report for a Lambda function, showing average, max, and min duration every 5 minutes.
filter @type = "REPORT"
| stats avg(@duration), max(@duration), min(@duration) by bin(5m)
This query isolates the REPORT logs and uses stats to aggregate the built-in @duration field, giving you an instant performance overview.
Example 2: Troubleshooting Permission Errors
Data pipelines often fail due to IAM permission issues (e.g., a Glue job can't read from an S3 bucket). CloudTrail logs all API calls, and querying these logs is the definitive way to diagnose such problems.
Goal: Find failed API calls for a specific service and group them by error code.
# Assuming your CloudTrail log group is selected
filter eventSource = "s3.amazonaws.com" and ispresent(errorCode)
| stats count(*) by eventName, errorCode, errorMessage
This query filters for API calls to S3 that resulted in an error, then counts them by the specific API call (eventName) and the errorCode (e.g., AccessDenied). This will tell you exactly what action failed and why.
Test your understanding!
A Lambda function in your ETL pipeline is failing intermittently. You suspect an issue with how it handles certain records. The application logs unstructured messages like: [ERROR] Failed to process record_id: 12345 - Reason: Invalid data format.
Write a CloudWatch Logs Insights query to count the number of "Invalid data format" errors that have occurred in the last 24 hours.
Show answer
A simple and effective query would be:
fields @timestamp, @message
| filter @message like /Invalid data format/
| stats count(*) as errorCount
Explanation:
filter @message like /Invalid data format/: This filters the logs to find only the lines that contain the specific error string.stats count(*) as errorCount: This then counts the number of matching log events and presents the result aserrorCount.
This query quickly quantifies the problem without needing complex parsing, demonstrating the power of simple filtering and aggregation.
Conclusion
In this lesson, we moved from the what of monitoring (alarms) to the why (troubleshooting). You've seen how CloudWatch Logs Insights transforms log files from a passive record into an active, queryable database for diagnostics.
Key Takeaways:
- Logs Insights is for scale: It's designed to query across many log streams within a log group, making it ideal for distributed services like Glue and Lambda.
- The core pattern is
filter | parse | stats: Master this sequence to narrow down events, extract structured data, and aggregate the results into meaningful insights. parseis your most powerful tool: It allows you to impose a schema on-the-fly on unstructured or semi-structured log data, making it queryable.- Apply it across services: The same query principles can be used to troubleshoot performance in Glue, errors in Lambda, and permission issues via CloudTrail.
Next Up:
We have now covered how to monitor pipeline health and troubleshoot failures. The next logical step is to look at another critical aspect of operations: cost. In our next lesson, we will "Design S3 cost optimization strategies using storage classes, lifecycle policies, and S3 Intelligent-Tiering." You'll learn how to manage your data lake storage to be as cost-effective as possible without sacrificing performance.