Hello! Welcome to the first lesson in our module on Monitoring, Optimization, and Troubleshooting.
In the last module, we focused on building and orchestrating data pipelines, culminating in a lesson on using AWS Lambda for lightweight, event-driven transformations. We've built the "what" and the "how" of our pipelines; now we need to ensure they run reliably, efficiently, and correctly. This is where monitoring comes in.
This lesson addresses the learning outcome: Configure CloudWatch metrics and alarms for monitoring data pipeline health. As a Data Engineer, you won't just build pipelines; you'll be responsible for their operational health. Proactive monitoring is the key to identifying issues before they impact data quality or availability.
You're already proficient with CloudWatch Logs for debugging, which is a great foundation. Today, we'll build on that by diving deep into two other core components of CloudWatch: Metrics and Alarms. We'll cover how to define what "healthy" looks like for a pipeline and how to get automatically notified when things go wrong.
1. The Core of Pipeline Monitoring: Metrics and Alarms
At its heart, monitoring a data pipeline with CloudWatch involves two key concepts:
- Metrics: A time-series dataset representing a variable to monitor. AWS services automatically publish hundreds of metrics to CloudWatch. For example, AWS Lambda publishes the number of
Errors, Kinesis publishesGetRecords.IteratorAgeMilliseconds, and AWS Glue publishesglue.driver.jvm.heap.usage. These are the raw signals about your pipeline's health. - Alarms: A mechanism that watches a single metric over a specified time period. You define a threshold (e.g., more than 5 Lambda errors in 1 minute), and the alarm triggers an action (like sending you an email) if the metric breaches that threshold.
This simple but powerful combination allows you to move from reactive troubleshooting (digging through logs after a user reports a problem) to proactive monitoring.
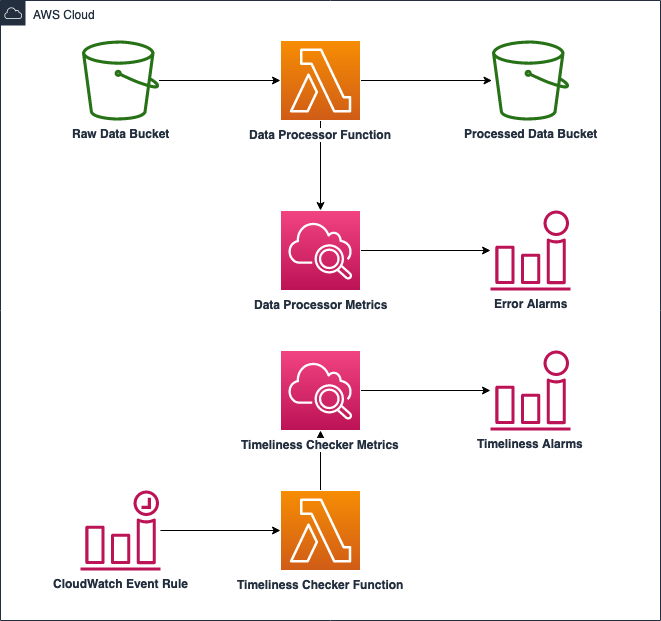
The diagram below shows a basic conceptual model. A data processor (like a Lambda function) runs and sends metrics to CloudWatch. Based on these metrics, CloudWatch Alarms can be triggered for issues like errors or data processing delays (timeliness).
2. How to Create a CloudWatch Alarm: A Practical Walkthrough
Let's walk through the process of creating an alarm. We'll use a common scenario that builds directly on our previous lesson: alarming on errors in a Lambda function.
The video below provides a detailed, step-by-step tutorial. While you watch, focus not just on the clicks in the console, but on the logic behind each configuration choice.
AWS Cloudwatch Alarm Setup Tutorial | Step by Step
This video from 'Be A Better Dev' is an excellent guide to setting up a CloudWatch alarm from start to finish. It clearly explains some of the most confusing concepts, like evaluation periods.
Watch the video from the beginning until 16:34. Pay special attention to these key stages: Selecting the Metric and Statistic (01:07 - 03:06): Note why Sum is chosen for errors over Average. Defining the Alarm Condition (03:06 - 04:47): Setting the static threshold for the metric. Configuring Evaluation Periods (04:47 - 10:06): This is a critical and often misunderstood concept. The blackboard explanation is very helpful for understanding the 'M out of N' datapoints to alarm. Handling Missing Data (10:06 - 13:52): Understanding the implications of treating missing data as good, bad, or ignored. Configuring Actions (13:52 - 16:34): Setting up an SNS topic for email notifications.
Let's summarize the most important configuration setting explained in the video: the relationship between Evaluation Period and Datapoints to Alarm.
This is often expressed as "M out of N":
- N is the
Evaluation Period. If you set a period of 5 minutes and an evaluation period of 3, N=3. This means the alarm looks at a 15-minute window (3 periods of 5 minutes each). - M is the
Datapoints to Alarm. If you set this to 2, it means at least 2 of the 3 data points in your 15-minute window must be breaching the threshold for the alarm to fire.
Setting M greater than 1 (e.g., "2 out of 3") is a powerful technique to reduce "flappy" or noisy alarms caused by brief, transient spikes. It ensures that an alert is only triggered for more sustained problems.
3. Key Metrics for Data Engineering Services
Knowing how to create an alarm is only half the battle. For the exam, you must know what to monitor for the key data engineering services. Let's explore some critical metrics.
A. AWS Glue Job Metrics
AWS Glue provides a set of enhanced "observability metrics" that give you deep insights into your ETL job performance. You first need to enable them.
Enhance monitoring and debugging for AWS Glue jobs using new job observability metrics
This AWS Big Data Blog post introduces the observability metrics for Glue jobs and demonstrates their value.
Read the introduction, then the 'Enable the new metrics', 'Use case', and 'Create a CloudWatch alarm' sections. Focus on: How to enable these metrics using a job parameter. How the workerUtilization metric can identify over-provisioned (and costly) jobs. The example of creating an alarm on skewness.job, a key indicator of data processing imbalance.
Key Takeaway for Glue: You can and should monitor metrics beyond basic success/failure. Metrics like glue.driver.workerUtilization and glue.job.skewness are crucial for performance tuning, cost optimization, and troubleshooting data-related bottlenecks. Setting an alarm on high skewness can alert you to a data distribution problem that is slowing down your job.
B. Kinesis Data Streams Metrics
For real-time pipelines, monitoring the health of your Kinesis stream is paramount to prevent data loss and processing delays.
Monitor the Amazon Kinesis Data Streams service with Amazon CloudWatch
The official AWS documentation lists the key metrics for Kinesis and recommends which ones to alarm on. These are frequent topics in exam questions.
Read the tables in the 'Basic stream-level metrics' and 'Enhanced shard-level metrics' sections to familiarize yourself with what's available. Then, focus carefully on the 'Recommended Amazon Kinesis Data Streams metrics' section. Understand what each of these recommended metrics signifies.
Let's highlight two of the most critical Kinesis metrics for the exam:
GetRecords.IteratorAgeMilliseconds: This is arguably the most important metric for Kinesis consumers. It measures how far behind the "head" of the stream your consumer is. A consistently increasing iterator age means your consumers can't keep up with the data being ingested. If this age exceeds the stream's retention period (default 24 hours), you will lose data permanently. You should always have an alarm on theMaximumstatistic of this metric.ReadProvisionedThroughputExceededandWriteProvisionedThroughputExceeded: These metrics track throttling events. If you see these metrics increasing, it means your producers or consumers are trying to read/write data faster than the stream's configured capacity allows. This is a primary indicator of a performance bottleneck.
Test your understanding!
You have a Kinesis Data Stream with a 24-hour retention period. Your consumer application, running on EC2, starts to experience performance degradation. The GetRecords.IteratorAgeMilliseconds metric for the stream climbs to 72,000,000 ms and stays there. What is the immediate risk, and what should you do?
Show answer
-
Immediate Risk: The iterator age is 72,000,000 ms, which is 20 hours (72,000,000 / 1000 / 3600). This is dangerously close to the 24-hour retention period. The immediate risk is permanent data loss. If the consumer falls more than 24 hours behind, the oldest records will expire from the stream before they can be processed.
-
Action: The priority is to investigate and resolve the consumer application's performance issue. This could involve scaling up the consumer fleet, optimizing the processing logic, or checking for downstream bottlenecks (e.g., a slow database). An alarm on this metric would have alerted you to the problem much earlier.
4. Reducing Alarm Noise with Composite Alarms
Sometimes, a single metric going into alarm isn't enough to warrant waking someone up at 3 AM. For example, a brief spike in Lambda latency might be acceptable, but a spike in latency and a spike in errors indicates a much more serious problem.
Composite Alarms solve this by creating alarms based on the states of other alarms. You can combine them with logical operators like AND, OR, and NOT.
AWS Cloudwatch Composite Alarms Tutorial (Part 2)
This follow-up video demonstrates how to create a composite alarm that fires only when one of two underlying alarms is in an alarm state.
Watch this video from the beginning to 06:26. Observe how the presenter combines a 'Lambda errors' alarm and a 'Lambda latency' alarm into a single composite alarm using an OR condition. This allows for a single, consolidated notification for multiple related failure conditions.
Using composite alarms is a best practice for creating a robust and low-noise monitoring strategy for complex data pipelines. For instance, you could create a composite alarm that fires if (Glue Job Failed is in ALARM) AND (Upstream Kinesis IteratorAge is OK), helping you distinguish a Glue-specific failure from a broader data delay issue.
The architecture below shows a complex monitoring solution where consolidated alerting (via composite alarms and centralized notifications) would be highly valuable.

Conclusion
In this lesson, we established the foundation of pipeline monitoring in AWS. You learned not just the mechanics of creating CloudWatch Alarms, but also the data engineering context for what to monitor and why.
Key Takeaways:
- Monitoring is Proactive: Use CloudWatch Metrics and Alarms to detect issues like data delays, processing errors, and performance bottlenecks before they become critical failures.
- Tune Your Alarms: Understand the "M out of N" configuration (
Datapoints to Alarm/Evaluation Periods) to create stable alarms that don't trigger on transient spikes. - Know Your Service Metrics: For the exam, be especially familiar with
GetRecords.IteratorAgeMillisecondsand...ProvisionedThroughputExceededfor Kinesis, and new observability metrics likeskewnessfor AWS Glue. - Consolidate with Composite Alarms: Use composite alarms to reduce alarm fatigue and create more intelligent alerts based on combinations of conditions.
Next Up:
An alarm tells you that something is wrong. The next step is to find out what and why. In our next lesson, we will focus on "Implement CloudWatch Logs Insights queries for troubleshooting ETL and data processing failures." You'll learn how to use a powerful query language to rapidly search and analyze massive volumes of log data to pinpoint the root cause of pipeline failures.