Hello! Welcome to your final lesson in the "Monitoring, Optimization, and Troubleshooting" module.
In our last session, you learned how to systematically troubleshoot AWS Glue job failures by analyzing logs and metrics, focusing on common issues like out-of-memory errors. Today, we'll apply a similar analytical mindset to another critical area of data engineering: query performance. Since you have significant hands-on experience with Amazon Athena, this lesson will help you structure and deepen that knowledge for the certification exam.
This lesson is designed to help you master the learning outcome: Analyze and optimize slow-running queries in Amazon Athena using query execution plans. We will explore how to dissect Athena's query processing logic to pinpoint bottlenecks and apply targeted optimizations—a skill frequently tested through scenario-based questions.
1. The Anatomy of an Athena Query: Execution Plans
When you run a SQL query in any database system, the engine first creates a query execution plan. This is the step-by-step "recipe" the engine will follow to fetch, join, filter, and aggregate your data to produce the final result. By analyzing this plan, you can understand exactly how Athena is executing your query and identify which steps are inefficient or costly.
Athena provides two primary ways to see this plan:
EXPLAIN: This command shows the logical and distributed plan for a query without actually running it. It's a quick, free way to validate your SQL and see the intended execution flow. You won't be charged for data scans, but there may be minor AWS Glue charges for metadata retrieval.EXPLAIN ANALYZE: This command runs the query and then shows the distributed plan along with detailed runtime statistics for each stage, such as CPU time, data processed, and rows output. This is the most powerful tool for finding real-world bottlenecks, but it incurs standard Athena query costs because it scans the data.
Fortunately, the Athena console now provides excellent visual tools that make interpreting these plans much more intuitive than reading raw text output.
2. Visualizing and Understanding Query Plans
Let's dive into how to use the modern Athena console tools to analyze a query. The following video from AWS provides a perfect walkthrough of the EXPLAIN button and the "Query stats" tab.
Optimize Amazon Athena Queries with New Query Analysis Tools | Amazon Web Services
This video, 'Optimize Amazon Athena Queries with New Query Analysis Tools', demonstrates the visual query analysis features built into the Athena console. It's the best way to understand how to approach query optimization in a practical setting.
Please watch from the beginning until 09:03. As you watch, focus on the following key concepts: EXPLAIN Button: How to generate a visual plan before running a query. Logical vs. Distributed Plan: Notice the difference in the visualizations. The logical plan shows the conceptual flow, while the distributed plan shows how work is broken into stages for parallel execution. Query Stats Tab: Pay close attention to the Query timeline (Queuing, Planning, Execution, Service Processing) and the Execution Details flowchart. This is where you'll find the most valuable information after a query runs.
Key Concepts from the Video
Let's break down the core components you just saw.
Logical vs. Distributed Plans
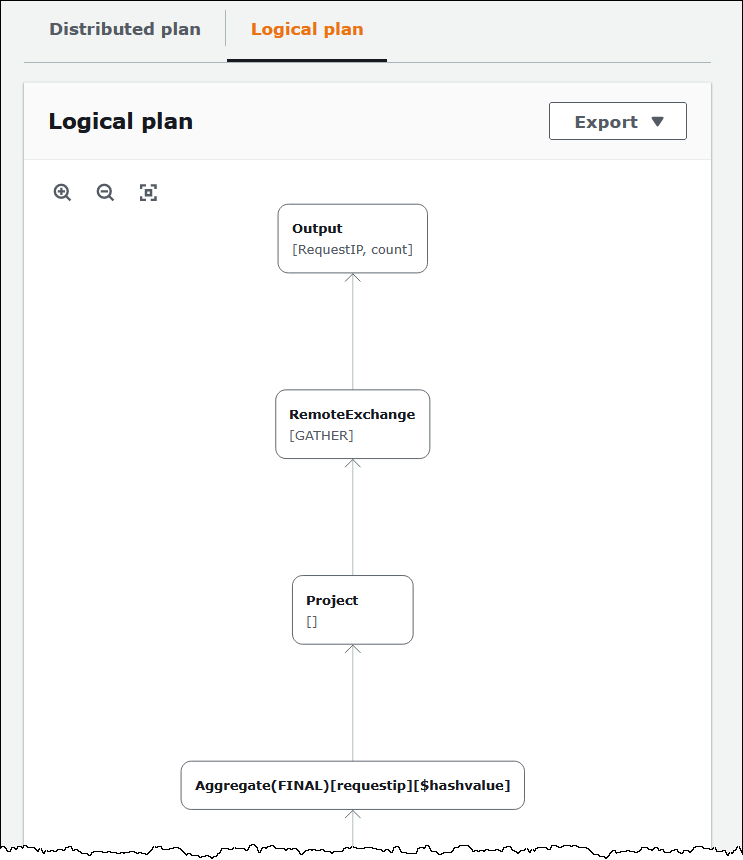
- Logical Plan: A high-level, tree-like representation of the operations in your query (e.g., scan table, join, aggregate, output). It shows the logical flow of data.
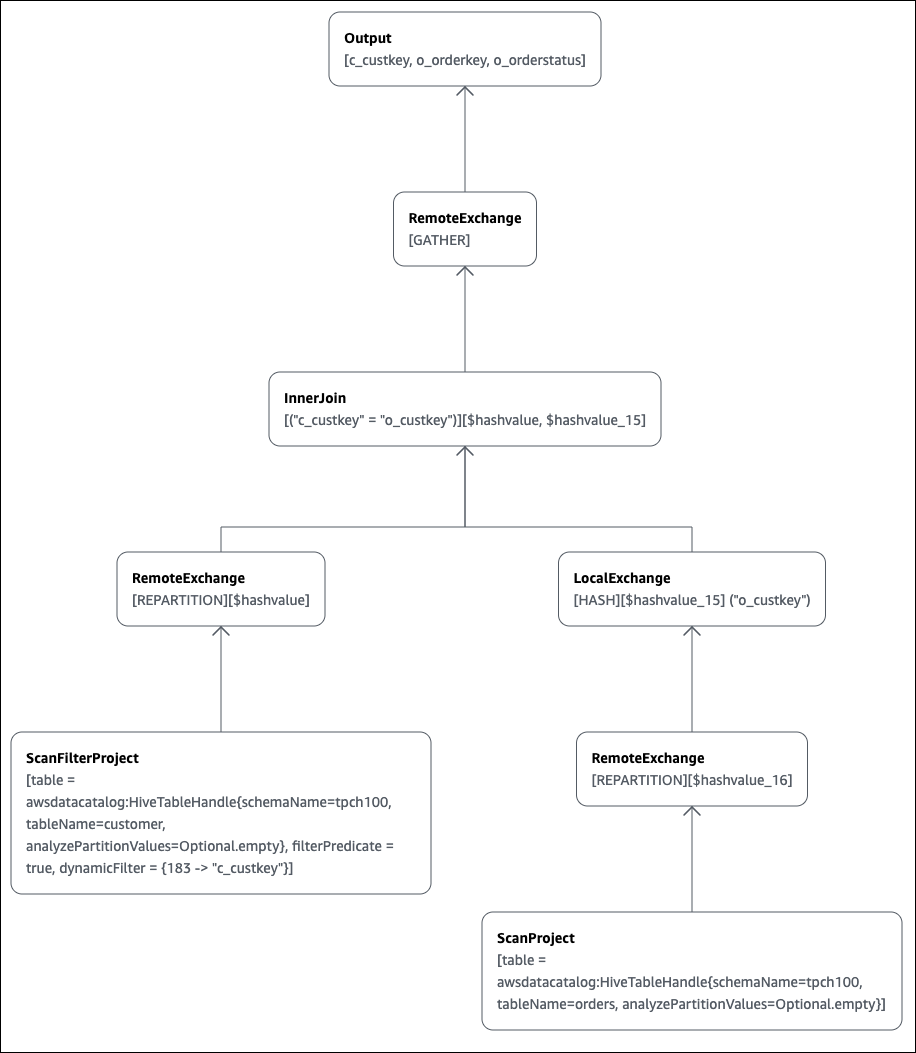
- Distributed Plan: A more detailed view showing how the query is broken down into stages (or fragments) that can be executed in parallel across multiple worker nodes. This plan reveals how data is exchanged between nodes, which is often a source of performance bottlenecks.
To better understand the terms you see in these plans, you can refer to the official AWS documentation.
Understand Athena EXPLAIN statement results
This documentation page, 'Understand Athena EXPLAIN statement results', serves as a glossary for the terms used in execution plans. You don't need to memorize it, but it's a valuable reference.
Quickly read through this page to familiarize yourself with terms like: Fragment types (SINGLE, HASH, BROADCAST, SOURCE) Exchange types (GATHER, REPARTITION, REPLICATE) Scanning operators (TableScan, ScanFilterProject) Join distribution types (Partitioned, Replicated) Understanding these will help you decipher what the query engine is doing under the hood.
3. Common Optimization Scenarios
Now for the most important part: using these tools to identify and fix common performance problems. We will continue with the video, which demonstrates several classic optimization scenarios.
Scenario 1: Suboptimal Join Order
The order in which you join tables can have a massive impact on performance. The general rule is to place your largest table on the left side of the join and the smaller table on the right. This allows the query engine (Presto/Trino) to build a hash table from the smaller right-side table in memory and stream the larger left-side table past it, which is more memory-efficient.
Let's see how to diagnose and fix this.
Optimize Amazon Athena Queries with New Query Analysis Tools | Amazon Web Services
We'll continue with the same AWS video, which now demonstrates how to identify an incorrect join order and measure the performance improvement after fixing it.
Watch the segment from 09:03 to 13:46. Pay attention to how the presenter uses the Execution Details to: Identify which table is on which side of the join (by looking at the input stages). See the amount of data and number of rows coming from each table. Compare the execution time of the join stage before and after reordering the tables in the SQL query.
- Diagnosis: In the
Execution Detailsview, inspect theInnerJoinstage. Check its input stages (RemoteSource [2],RemoteSource [3]). Click on each source stage to see which table it is scanning and how much data it produced. If the stage feeding the right side of the join is producing significantly more data than the left, the join order is likely suboptimal. - Solution: Rewrite your SQL query to put the larger table on the left of the
JOINkeyword.
Scenario 2: Planning Bottleneck Due to Many Partitions
If your table has tens of thousands of partitions, Athena can spend a significant amount of time just fetching the partition metadata from the AWS Glue Data Catalog before it even starts executing the query.
Optimize Amazon Athena Queries with New Query Analysis Tools | Amazon Web Services
The next segment of the video shows how to identify this 'planning phase' bottleneck.
Watch from 13:46 to 15:07. Focus on how the Query timeline in the Query stats tab immediately reveals the problem. Note the proposed solutions.
- Diagnosis: The Query timeline shows a disproportionately long "Planning" phase compared to the "Execution" phase.
- Solution:
- Partition Projection: If your partitions follow a predictable pattern (e.g., dates), you can configure partition projection in your table properties. This allows Athena to calculate partition locations without calling Glue, drastically reducing planning time.
- Glue Partition Indexing: Enable partition indexes on your Glue table. This allows Athena to fetch only the metadata for the partitions relevant to your query's
WHEREclause.
Scenario 3: Inefficient GROUP BY Clause
GROUP BY operations can be memory-intensive. The engine needs to hold the distinct group keys in memory. Using too many columns or columns with very high cardinality (many unique values) can lead to poor performance or even out-of-memory errors.
Optimize Amazon Athena Queries with New Query Analysis Tools | Amazon Web Services
Finally, let's look at how to analyze the impact of a GROUP BY clause.
Watch from 15:07 to the end (17:31). Observe how the presenter compares two queries—one with four GROUP BY columns and one with two. Notice the impact on the Aggregate operator's execution time and output data size.
- Diagnosis: The
Execution Detailsshow that a stage containing anAggregateoperator has a very long execution time and is processing a large volume of data. - Solution: Limit the number of columns in your
SELECTandGROUP BYclauses to only what is absolutely necessary. Fewer columns mean less memory pressure during aggregation.
Test your understanding!
You are analyzing a slow-running Athena query that joins a large sales table (1 billion rows, 500 GB) with a smaller stores table (2,000 rows, 1 MB). The query is written as:
SELECT
  st.store_name,
  SUM(sa.amount)
FROM
  stores st
JOIN
  sales sa ON st.store_id = sa.store_id
WHERE
  st.region = 'north-america'
GROUP BY
  st.store_name;
When you view the EXPLAIN (TYPE DISTRIBUTED) plan, you see that the stores table is on the left side of the join and the sales table is on the right. What is the primary performance issue with this query, and how would you rewrite it for optimal performance?
Show answer
-
Issue: The primary performance issue is the suboptimal join order. The small
storestable is on the left, and the massivesalestable is on the right. The query engine will likely attempt to stream thestorestable and build a hash table from the entiresalestable, which would consume an enormous amount of memory and be extremely slow. -
Solution: You should rewrite the query to place the largest table (
sales) on the left side of the join. This allows the engine to build a hash table from the much smallerstorestable and stream the largesalestable past it, which is the most efficient method.SELECT st.store_name, SUM(sa.amount) FROM sales sa -- Large table on the left JOIN stores st ON sa.store_id = st.store_id -- Small table on the right WHERE st.region = 'north-america' GROUP BY st.store_name;
Conclusion
Mastering query optimization is a continuous process, but understanding how to use execution plans is the most crucial first step. With these tools, you can move from guessing to making data-driven decisions about how to improve your Athena queries.
Key Takeaways:
- Start with the Plan: Use the
EXPLAINbutton orEXPLAINstatement to preview the query plan and the Query stats tab (orEXPLAIN ANALYZE) to see actual runtime statistics. - Identify the Bottleneck Phase: Use the Query timeline to see if the bottleneck is in
Planning(likely a partition metadata issue) orExecution(a join, aggregation, or scan issue). - Analyze the Execution Flow: Use the Execution Details view to trace the flow of data through stages and operators, checking data sizes and execution times for each step.
- Apply Common Optimizations:
- Joins: Ensure the largest table is on the left.
- Partitions: Ensure your
WHEREclause is filtering on partition keys to enable partition pruning. Use partition projection if planning time is high. - Aggregations: Minimize the number of columns in
GROUP BYclauses.
Next Up:
You have now completed the "Monitoring, Optimization, and Troubleshooting" module, equipping you with essential skills for maintaining robust and efficient data pipelines. We now pivot from performance and reliability to another critical pillar of data engineering: governance. In our next lesson, we will begin the "Data Governance and Auditing" module by learning to "Apply data classification and tagging to AWS resources for governance purposes." This is the foundation for managing costs, security, and compliance across your data estate.