Hello! Welcome to your next lesson in the "Monitoring, Optimization, and Troubleshooting" module.
In our previous session, we focused on proactively managing compute costs using models like Savings Plans and Reserved Nodes. Today, we shift from proactive optimization to reactive troubleshooting—a critical skill for any data engineer responsible for maintaining reliable data pipelines. Your experience with CloudWatch Logs will be a great asset as we dive into the specific context of AWS Glue.
This lesson will prepare you to master the learning outcome: Troubleshoot AWS Glue job failures using CloudWatch Logs and metrics (e.g., out-of-memory, permissions). We will explore the common points of failure in Glue jobs and equip you with a systematic approach to diagnose and resolve them, a topic frequently tested in the AWS Data Engineer - Associate exam.
1. The Data Engineer's Troubleshooting Toolkit
When a Glue job fails, your investigation starts at the job run's detail page. This central dashboard provides the initial clues and directs you to the essential tools for a deeper analysis: CloudWatch Logs and Metrics.
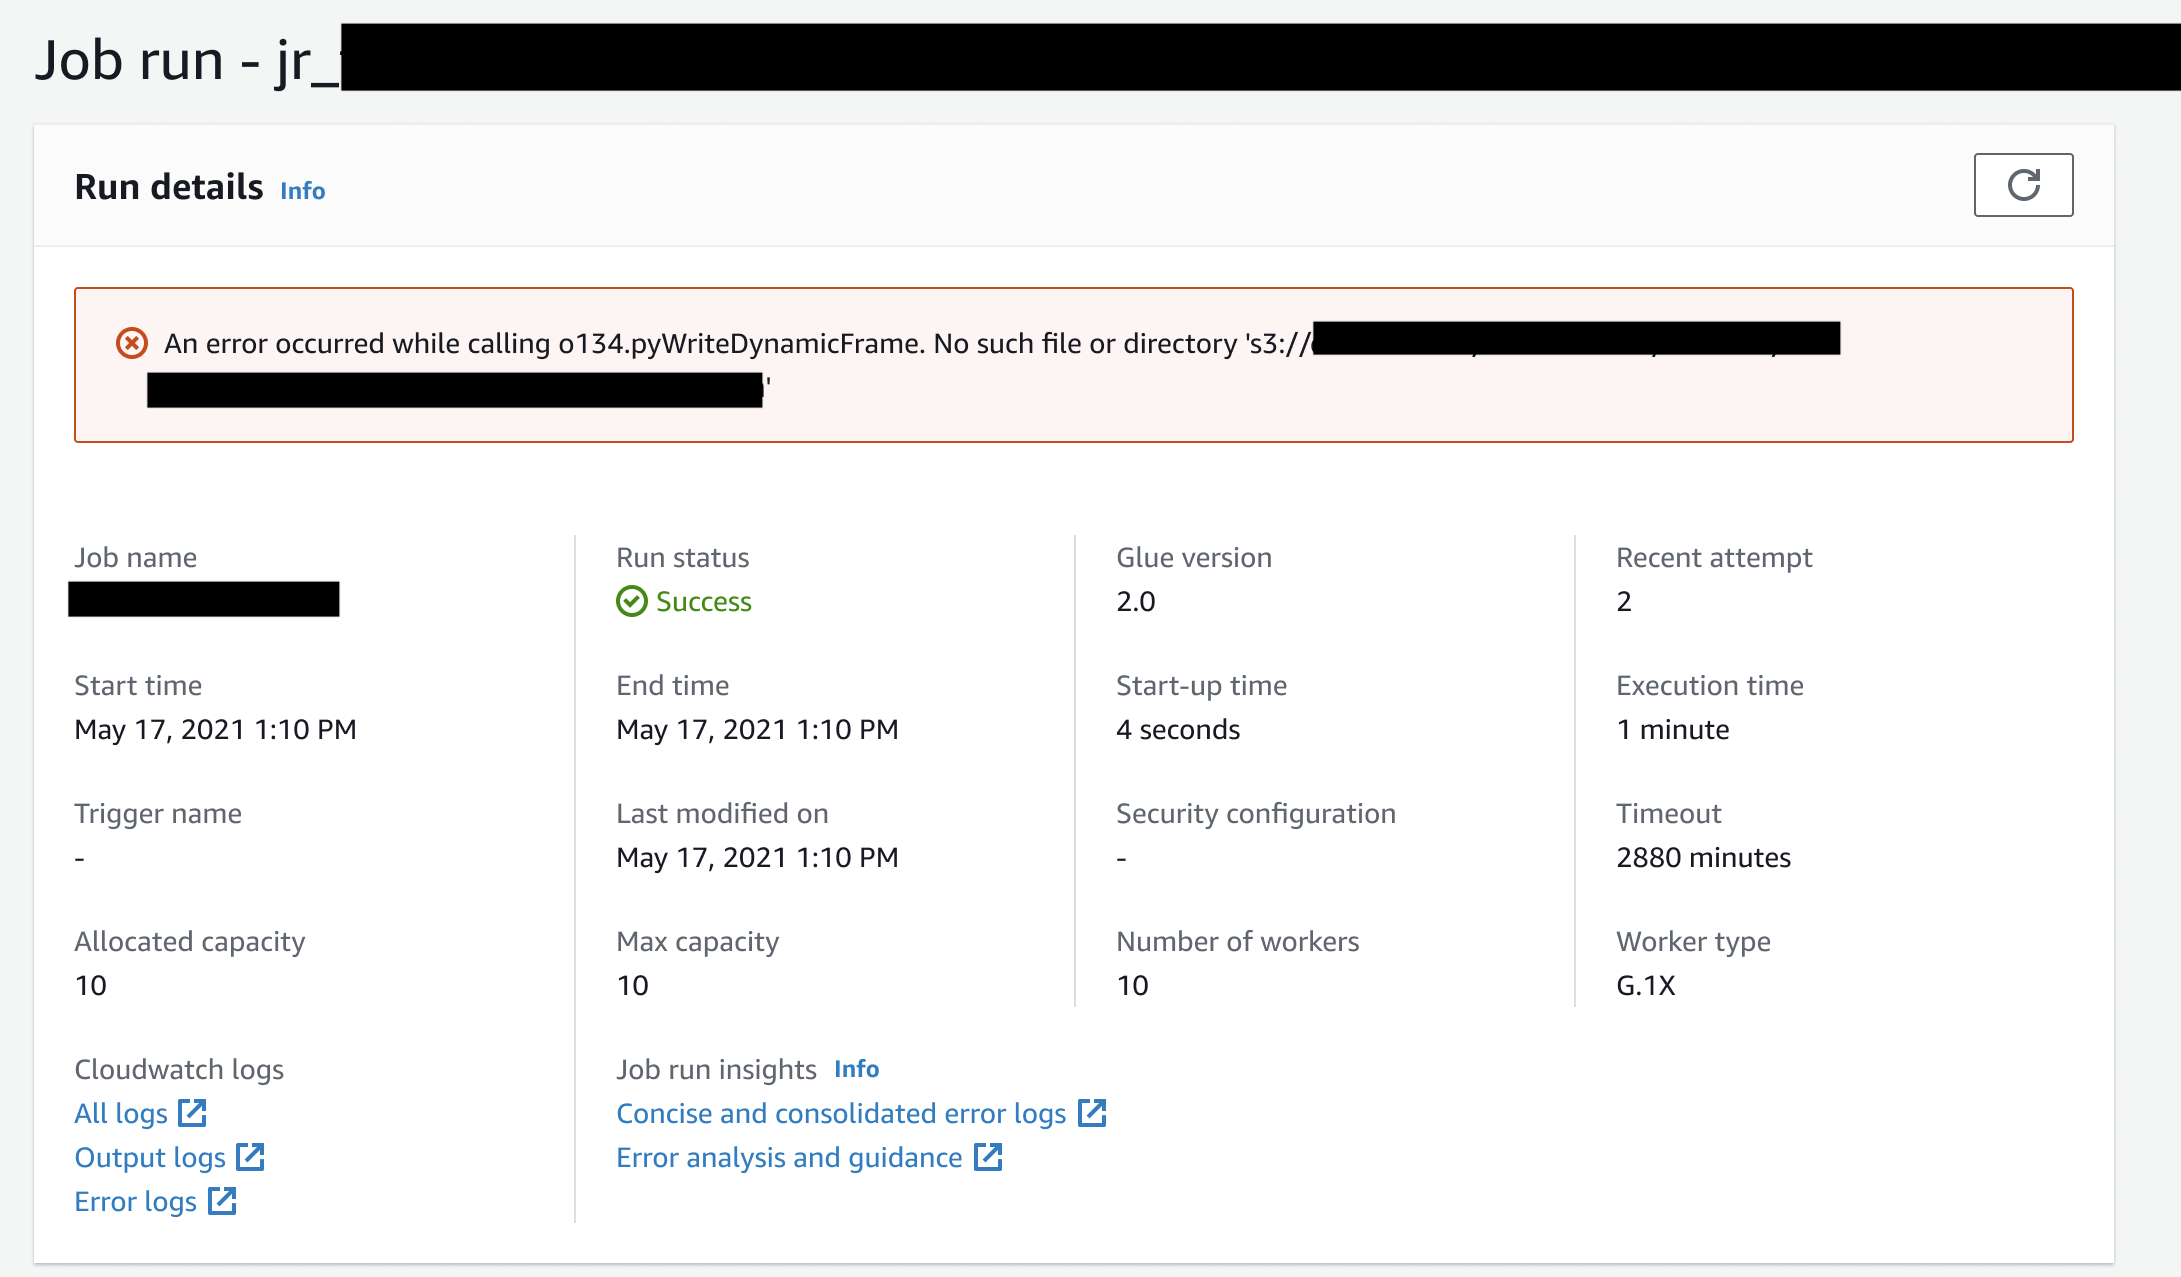
As you can see, this page gives you three key entry points for troubleshooting:
- Error Message: A high-level summary of the failure. It's often generic (e.g.,
Command failed with exit code 1), but sometimes it's specific enough to point you in the right direction. - CloudWatch Logs: This is where you'll find the detailed execution logs and error stack traces. A standard Glue job generates several log streams, but the most important for troubleshooting are:
- Error log (
/aws-glue/jobs/error): Your primary destination. It contains error messages and the full Java/Python stack trace that caused the failure. - Output log (
/aws-glue/jobs/output): Contains the standard output from the Apache Spark driver, includingprintstatements from your script. - Job run logs (
/aws-glue/jobs/logs-v2/): For Glue 2.0+ jobs, these provide separate, detailed logs for the driver and each executor, which is invaluable for isolating problems.
- Error log (
- CloudWatch Metrics: These provide a quantitative view of your job's performance and resource consumption over time. They are crucial for identifying trends that lead to failure, such as steadily increasing memory usage.
2. The Most Common Culprit: Out-of-Memory (OOM) Errors
Out-of-memory errors are the most frequent and often the most challenging issues you'll face with Spark-based systems like AWS Glue. These errors occur when either the driver node or an executor node runs out of memory. Understanding the difference is key to solving the problem.
To build a solid foundation, let's first explore the common causes of OOM errors in Spark from a conceptual standpoint.
Spark Out of Memory Issue | Spark Memory Tuning | Spark Memory Management | Part 1
This video, 'Spark Out of Memory Issue', provides an excellent, platform-agnostic overview of why Spark applications fail due to memory pressure. This will help you understand the root causes before we look at how to solve them in Glue.
Watch the entire video (about 7.5 minutes). As you watch, focus on distinguishing the causes of driver OOM from executor OOM. Pay attention to terms like collect, broadcast join, data skew (large partitions), and high concurrency.
As the video explained, the reasons for failure are fundamentally different for the driver and executors:
- Driver OOM: Typically happens when you try to pull too much data from the distributed executors back to the single driver node. Common causes include:
- Using
.collect()on a large DataFrame. - A broadcast join where the "small" table is too large to fit in the driver's memory.
- Using
- Executor OOM: Happens on the worker nodes during data processing. Common causes include:
- Data Skew: One executor gets a partition that is significantly larger than the others, overwhelming its memory.
- Inefficient Transformations: Operations that generate a large amount of intermediate data (e.g., a complex join or aggregation).
- High Concurrency: Assigning too many parallel tasks (cores) to an executor, forcing it to handle too much data and metadata at once.
Now, let's see how to diagnose and fix these issues within AWS Glue.
Scenario-Based Troubleshooting
We'll use the official AWS documentation, which provides practical scenarios that mirror what you might see on the exam.
Debugging OOM exceptions and job abnormalities
The AWS documentation 'Debugging OOM exceptions and job abnormalities' walks through two classic OOM scenarios. We will examine both.
Please read both sections: 'Debugging a driver OOM exception' and 'Debugging an executor OOM exception'. For each scenario, focus on three things: The Symptom: How do the CloudWatch metrics reveal the problem (e.g., which line on the graph spikes)? The Diagnosis: What do the CloudWatch logs say (e.g., which specific error message appears)? The Solution: What is the recommended fix for the issue?
Let's break down the key takeaways from those scenarios:
Scenario 1: Driver OOM (from reading millions of small files)
- Symptom: The driver memory usage metric spikes, while executor memory remains low and flat.
- Diagnosis: The error log contains
java.lang.OutOfMemoryError: Java heap space. This happens because the Spark driver tries to list and hold metadata for all one million files in its memory before processing begins. - Solution: Use AWS Glue's
groupingfeature. When reading from S3 into aDynamicFrame, you can enable grouping, which coalesces small files into larger chunks. This dramatically reduces the amount of metadata the driver needs to manage.
Scenario 2: Executor OOM (from a large JDBC read)
- Symptom: The average executor memory usage metric spikes sharply and crosses the safety threshold. You may see the number of active executors drop and then recover as YARN kills a failing executor and launches a replacement.
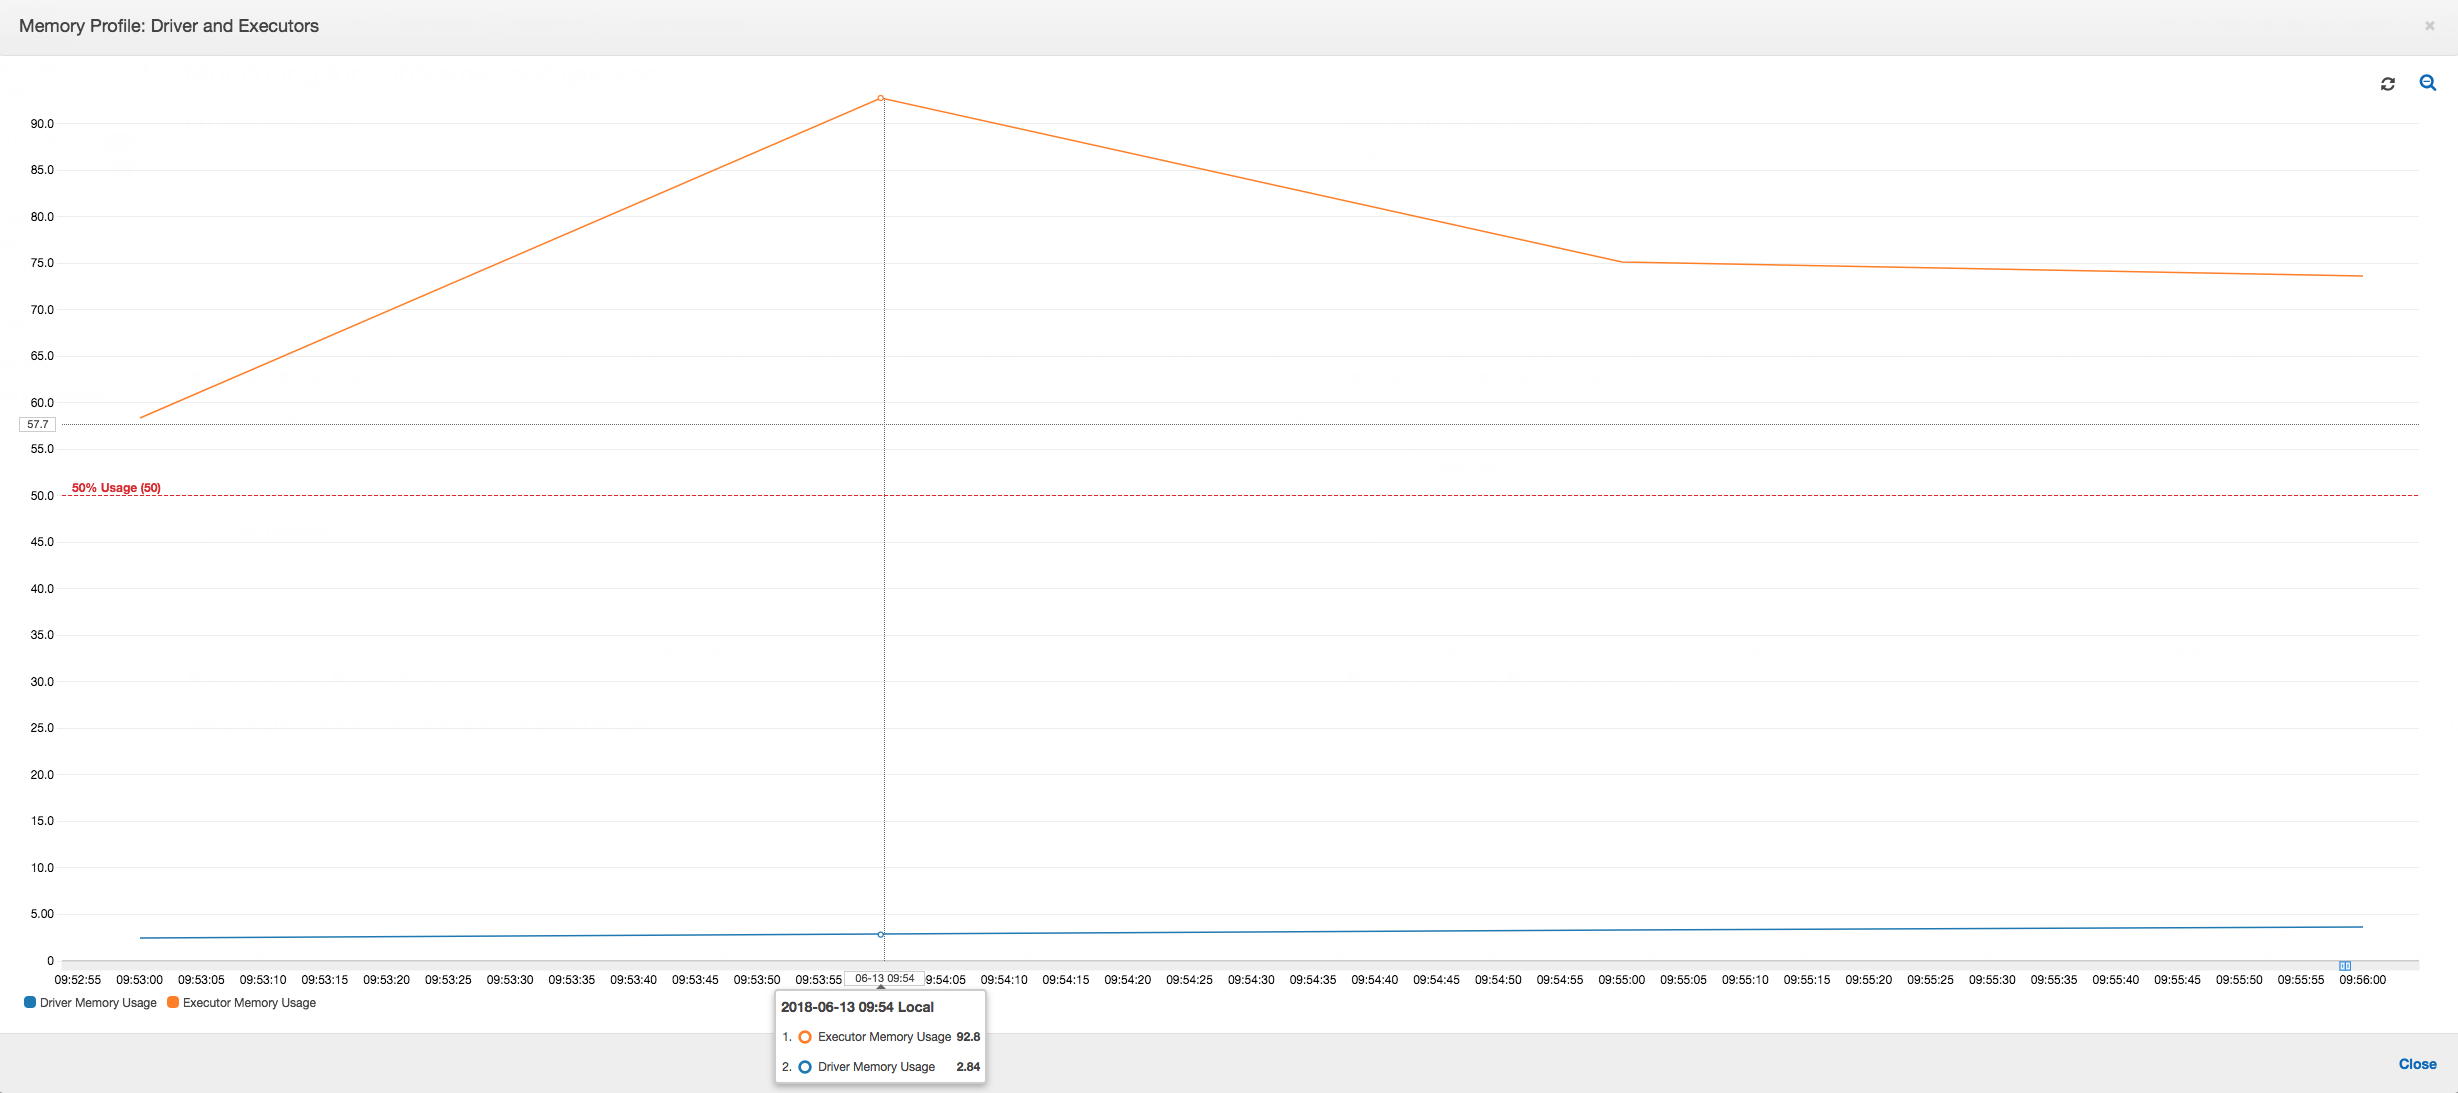
- Diagnosis: The error log contains messages like
Container killed by YARN for exceeding memory limitsand suggests boostingspark.yarn.executor.memoryOverhead. This happens because the JDBC driver, by default, tries to fetch all rows from the database table into the executor's memory at once. - Solution: Use
DynamicFramesto read from the JDBC source. Glue'sDynamicFramereader for JDBC uses a sensible defaultfetchsize(1,000 rows), preventing the executor from being flooded with data.
3. Leveraging Glue Observability Metrics
For jobs using AWS Glue 4.0 and later, you have access to powerful Observability Metrics. These go beyond simple memory usage and provide categorized error counts and detailed resource utilization metrics.
Monitoring with AWS Glue Observability metrics
Let's explore the AWS documentation on these enhanced metrics to see how they aid troubleshooting.
First, skim the large table in the 'Observability metrics' section. Don't memorize it, but notice the level of detail available, such as glue.driver.memory.heap.used.percentage and glue.ALL.memory.total.used.percentage. Then, carefully review the table under the 'Error categories' section. This is highly relevant for the exam.
The Observability Metrics are a game-changer for diagnostics. Key takeaways:
- Specific Error Metrics: Instead of just seeing a generic failure, Glue emits a metric for the specific failure type, such as
glue.error.OUT_OF_MEMORY_ERRORorglue.error.PERMISSION_ERROR. You can graph these over time to identify recurring problems across all your jobs. - Granular Resource Metrics: You get detailed memory and disk usage percentages for both the driver and the aggregate of all executors (
ALL). This makes it trivial to distinguish a driver-side issue from an executor-side issue. - Proactive Alerting: You can set CloudWatch Alarms on these metrics. For example, you could create an alarm that triggers if
glue.ALL.memory.total.used.percentageexceeds 80% for 5 minutes, notifying you of potential OOM issues before the job fails.
4. Troubleshooting Other Common Failures
While OOM is the most common issue, you must be prepared to troubleshoot other failures.
Permission Errors
- Cause: The IAM role associated with the Glue job lacks the necessary permissions to access a resource.
- Symptoms: The job fails quickly, and the error log contains an
AccessDeniedExceptionor a similar authorization failure message. - Common Missing Permissions:
s3:GetObject/s3:PutObjectfor S3 source and target locations.kms:Decrypt/kms:GenerateDataKeyif the data in S3 is encrypted with a customer-managed KMS key.glue:GetTable,glue:GetPartitionsto read from the AWS Glue Data Catalog.- Permissions to connect to a JDBC source (e.g.,
secretsmanager:GetSecretValueif credentials are in Secrets Manager).
- Observability Metric:
glue.error.PERMISSION_ERROR.
Disk Space Errors
- Cause: Spark uses local disk on executor nodes for shuffle operations (when data is exchanged between executors). A large shuffle can exhaust the available disk space.
- Symptoms: The error log will contain messages like
No space left on device. - Metric to Watch:
glue.ALL.disk.used.percentage. - Solution:
- Increase Workers: Add more workers to the job. This increases the total amount of available shuffle disk space across the cluster.
- Change Worker Type: Switch to a worker type with more local disk storage (e.g., from G.1X to G.2X).
Test your understanding!
You are troubleshooting a failing AWS Glue job. CloudWatch metrics show that the glue.ALL.memory.heap.used.percentage remains low (<20%), but the glue.driver.memory.heap.used.percentage consistently climbs to 95% just before the job fails. The job reads a large fact table from S3 and joins it with a dimension table that is 800 MB in size.
What is the most likely cause of the failure, and what is a potential solution?
Show answer
-
Cause: This is a classic Driver Out-of-Memory (OOM) error. The metrics clearly show the memory pressure is on the driver, not the executors. The likely culprit is an oversized broadcast join. By default, Spark might try to broadcast the 800 MB dimension table, which involves pulling the entire table into the driver's memory before sending it to the executors. This is often too large for the default driver memory.
-
Solution: You could disable the broadcast join for this specific operation by setting the Spark configuration
spark.sql.autoBroadcastJoinThresholdto-1. This will force Spark to use a more memory-efficient shuffle-based join, which distributes the work across executors instead of overloading the driver. Alternatively, you could increase the driver's memory by choosing a larger worker type for the driver (if using Glue 3.0+ with separate driver/worker types) or increasing the memory of all workers.
Conclusion
Congratulations on completing this lesson and the "Monitoring, Optimization, and Troubleshooting" module! You've learned to manage costs and now to diagnose and fix the pipelines you've built.
Key Takeaways:
- Systematic Troubleshooting: Start at the Glue Job Run page, then dive into CloudWatch Error Logs for specific messages and CloudWatch Metrics for resource utilization trends.
- Driver vs. Executor: OOM errors are the most common failure. It's crucial to identify whether the bottleneck is on the single driver node or the distributed executor nodes.
- Leverage Observability Metrics: For modern Glue versions, use the detailed Observability Metrics to quickly categorize errors (
glue.error.OUT_OF_MEMORY_ERROR,glue.error.PERMISSION_ERROR) and monitor resource health (...memory...used.percentage). - Map Symptoms to Causes:
- Driver memory spike →
collect(), oversized broadcast join, too many small files. - Executor memory spike → Data skew, inefficient read (e.g., JDBC fetch size), complex transformations.
AccessDeniedExceptionin logs → Missing IAM permissions.No space left on devicein logs → Shuffle-heavy job exceeding available disk.
- Driver memory spike →
Next Up:
Having reliable and optimized pipelines is essential, but so is securing and governing the data within them. In our next lesson, we will begin the "Data Governance and Auditing" module by tackling a foundational practice: "Apply data classification and tagging to AWS resources for governance purposes." Proper tagging is the first step toward effective cost allocation, access control, and data lifecycle management.