Hello! Welcome back.
In our previous lesson, we rolled up our sleeves and learned how to write a PySpark script to perform the core data transformations—filtering, grouping, joining—that are the backbone of any ETL process. You now have the code, but the next crucial step is running it at scale on a cluster.
This lesson directly addresses that step, fulfilling the learning outcome: Submit a Spark application to an EMR cluster and monitor its execution using the Spark UI. We will cover the primary methods for submitting your job and, just as importantly, how to peel back the layers to see what's happening under the hood. This is where your data quality engineering mindset for inspection and verification will be invaluable.
Let's get started.
1. Submitting Jobs with EMR Steps
The most common and straightforward way to run a Spark job on an existing EMR cluster is by submitting it as a Step. A step is simply a unit of work that you ask the cluster to perform. EMR provides a "Spark application" step type that handles the details of running your script via the spark-submit command.
Let's review the official AWS documentation to understand the configuration options.
Add a Spark step - Amazon EMR - AWS Documentation
The AWS Documentation page 'Add a Spark step' provides a clear, concise guide on submitting Spark jobs via the console. This is a foundational method you should know for the exam.
Read the section titled 'To submit a Spark step using the console'. Pay close attention to the descriptions of 'Deploy mode' (Client vs. Cluster), 'Application location', and 'Arguments'. We'll explore these further.
As you read, the key concepts to internalize are:
- Application Location: This is typically an S3 URI pointing to your Python (
.py) script or packaged JAR file. - Arguments: This is how you pass parameters to your script, such as input/output S3 paths.
- Deploy Mode: This is a critical Spark concept.
- Cluster Mode: The Spark driver program runs inside an application master process on one of the cluster's worker nodes. This is the preferred mode for production jobs, as the driver's lifecycle is managed by YARN and is not tied to your client session.
- Client Mode: The driver runs on the primary (master) node. This is useful for interactive development and debugging, but if the primary node is heavily loaded or the client connection is lost, it can affect your application.
Now, let's see this in action.
Intro to Amazon EMR - Big Data Tutorial using Spark
The following video clip from 'Intro to Amazon EMR' by jayzern demonstrates exactly how to configure an EMR step through the AWS console.
Watch from 13:56 to 15:00. Notice how the S3 URIs for the Python script and the input/output data locations are passed into the 'Arguments' field, which corresponds to what your argparse module in the Python script would expect.
2. Alternative Submission Methods
While using EMR steps is common, the Data Engineer exam expects you to know other methods that are used for development, debugging, and automation.
A. Interactive Submission via SSH
For debugging and rapid development, it's often useful to connect directly to the EMR cluster's primary node and submit your job from the command line. This gives you immediate feedback and access to logs. The process involves:
- Enabling SSH access to the primary node (by configuring its security group).
- Connecting via SSH using the appropriate
.pemkey file. - Copying your script to the primary node (e.g., using
aws s3 cp). - Running
spark-submitwith the necessary arguments.
AWS EMR Big Data Processing with Spark and Hadoop | Python, PySpark, Step by Step Instructions
The video 'AWS EMR Big Data Processing with Spark and Hadoop' provides a clear walkthrough of this entire SSH and submit process.
Watch from 12:53 to 15:10. The video demonstrates how to SSH into the primary node, create the script file (in this case, using vi), and then execute spark-submit main.py. This shows the raw spark-submit command in action.
B. Automated Submission via AWS CLI
For automating your data pipelines, you'll almost always use a command-line interface or SDK rather than the AWS console. The AWS CLI allows you to add steps to a running cluster programmatically.
Add a Spark step - Amazon EMR - AWS Documentation
Let's refer back to the AWS documentation to see the official CLI syntax.
Review the section 'To submit work to Spark using the AWS CLI'. Focus on the aws emr add-steps command. You'll see how the console fields map to CLI arguments like --cluster-id and the JSON structure for --steps.
This CLI command is the building block for orchestration. A tool like AWS Step Functions or a CI/CD pipeline would execute this command to kick off an EMR job.
3. Monitoring Job Execution
Submitting the job is only half the battle. Knowing how to monitor it, diagnose failures, and spot performance bottlenecks is a critical skill.
A. Basic Monitoring: Step Logs
Your first stop for debugging is the set of log files associated with your EMR step. In the EMR console, next to each step, you'll find links to three types of logs stored in S3:
stdout: The standard output stream from your application. Useful for seeingprint()statements.stderr: The standard error stream. This is where you'll find error messages and Python stack traces.controller: Logs from EMR itself about the execution of the step.
B. Advanced Monitoring: The Spark UI
For a much deeper look into your application's execution, you need the Spark UI. This web interface provides a wealth of information about jobs, stages, tasks, resource usage, and the execution plan.
How to Access the Spark UI:
In the past, accessing this UI required setting up an SSH tunnel. While that's still possible, modern EMR versions offer a much simpler way.
Access the Spark web UIs - Amazon EMR
The AWS documentation page 'Access the Spark web UIs' explains the modern, simplified access method.
Read the short section that begins 'With Amazon EMR release 5.25.0 and later...'. This describes the 'persistent application user interfaces' feature, which allows you to access the Spark History Server UI directly from the AWS Console after a job is complete, without any SSH tunneling.
What to Look For in the Spark UI:
Once you're in the UI, you'll see several tabs. Here's what to focus on:
- Jobs: An action in Spark (e.g.,
count(),save()) triggers a job. - Stages: Jobs are divided into stages. A new stage is created whenever a "shuffle" is required—that is, when data needs to be redistributed across the cluster (e.g., for a
groupByorjoin). - DAG Visualization: The Directed Acyclic Graph shows the lineage of your data transformations and the dependencies between stages. It's a powerful visual tool for understanding the execution plan. Given your computer science background, you'll recognize this as a graphical representation of the logical and physical plan created by Spark's optimizer.
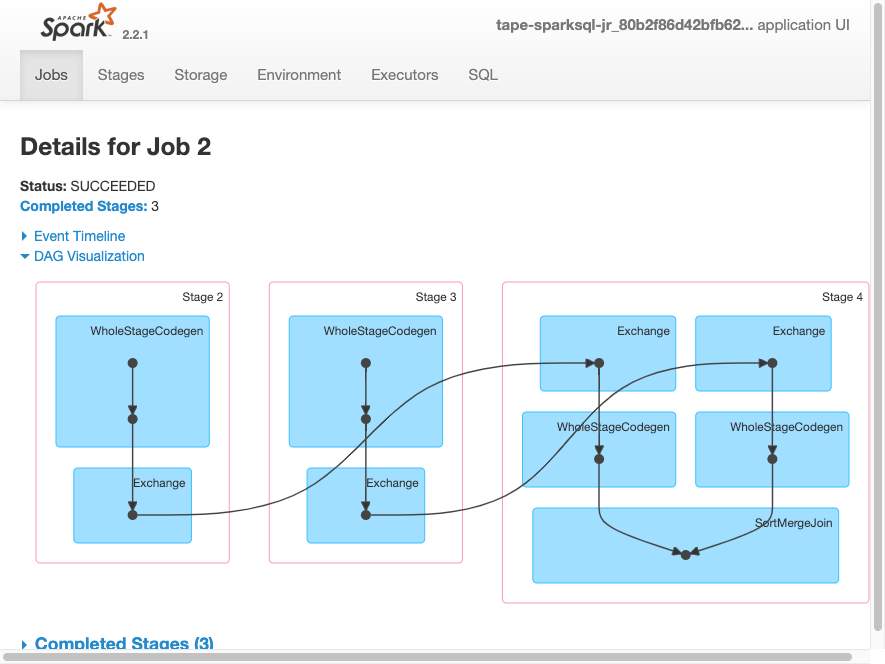
- Executors: This tab shows the resources (memory, cores) allocated to each executor running your tasks. It helps you verify that your cluster resources are being utilized effectively.
Test your understanding!
You submit a PySpark job as an EMR Step. The step fails after running for 10 minutes. The stdout log file is empty, and the stderr log contains a Java OutOfMemoryError. What is the most likely cause, and what are your next two steps for debugging and fixing the issue?
Show answer
-
Most Likely Cause: A Java
OutOfMemoryErrorin a Spark job almost always points to an issue with either the driver memory or executor memory. This can happen if you are collecting a very large dataset to the driver (.collect()) or if a single executor is trying to process a partition of data that is too large to fit in its allocated memory (data skew). -
Next Steps:
- Analyze the Spark UI: Access the Spark History Server UI for the failed application. Go to the Executors tab to see how much memory was allocated. Check the Stages tab to identify which stage failed. Look at the tasks within that stage to see if failures are concentrated on a few tasks, which might indicate data skew.
- Adjust Memory Configuration: Based on the analysis, adjust the Spark memory settings. You can do this by passing
spark-submitoptions in theArgumentsfield of your EMR step. For example, to increase executor memory, you would add:--conf spark.executor.memory=8g. You might also need to increase the driver memory with--driver-memory 4g. You would then resubmit the step with the new configuration.
Conclusion
Today you've bridged the gap between code and execution. You now know not just how to write a Spark script, but how to launch it on an EMR cluster and, crucially, how to monitor its vital signs.
Key Takeaways:
- You can submit Spark applications to EMR using EMR Steps in the console (most common), interactively via SSH and
spark-submit(for debugging), or programmatically via the AWS CLI (for automation). - Your first line of defense for debugging is the step logs (
stderris key for errors). - The Spark UI is the definitive tool for performance analysis, allowing you to inspect the execution plan (DAG), resource usage, and job/stage/task details.
Next Up:
So far, our focus with EMR has been on running batch processing jobs with Spark. But EMR is a versatile tool. In the next lesson, we will explore a different use case: "Implement Hive or Presto on EMR for interactive SQL-like querying of data in S3." This will shift our focus from programmatic ETL to ad-hoc, SQL-based data exploration on the same EMR platform.