Hello! Welcome back to our module on Amazon EMR.
In our previous lessons, we've focused on setting up the EMR infrastructure: configuring compute resources, locking down network access, and securing the data connection to S3 with EMRFS and encryption. Now that the stage is set, it's time to move from infrastructure to application and learn how to actually process data on the cluster.
This lesson directly addresses the learning outcome: Write a Spark application using PySpark to perform common data transformations (e.g., select, filter, join, groupBy). We'll explore the fundamental building blocks of data manipulation in PySpark, which is the Python API for Apache Spark. Given your background in computer science, you'll find that many of these concepts, like functions and data structures, are quite intuitive.
1. The Anatomy of a PySpark Application
At the heart of every Spark application is the SparkSession, which is the entry point to all Spark functionality. Once you have a SparkSession, you typically read data from a source (like S3) into a DataFrame. A DataFrame is a distributed collection of data organized into named columns. It is conceptually equivalent to a table in a relational database or a data frame in pandas, but with the power of distributed processing.
A crucial concept to grasp is the difference between Transformations and Actions in Spark.
- Transformations are operations on a DataFrame that produce a new DataFrame. Examples include
select,filter, andgroupBy. Transformations are lazy, meaning Spark doesn't execute them immediately. Instead, it builds up a logical plan of all the transformations you want to perform. - Actions are operations that trigger the execution of all the planned transformations and return a result. Examples include
show()(to display results),count()(to count rows), orwrite()(to save data).
This lazy evaluation model is a core feature of Spark's performance, as it allows Spark's Catalyst Optimizer to analyze your entire data flow and find the most efficient way to execute it.
PySpark Transformations and Actions | show, count, collect, distinct, withColumn, filter, groupby
To start, let's watch a short clip from the video 'PySpark Transformations and Actions' by Abhishek mamidi that clearly explains this fundamental difference.
Watch the first two minutes of the video (00:00 - 02:03). Focus on the distinction between lazy transformations and eager actions, and take note of the common examples provided for each.
2. Core DataFrame Transformations
Let's dive into the most common transformations you'll use in virtually every data engineering pipeline. For these examples, imagine we have a DataFrame called sales_df with columns like order_id, product_id, customer_id, sale_date, and amount.
A. Selecting and Filtering Data (select, filter)
These are the bread-and-butter operations for shaping your data.
select(): Used to choose a subset of columns from a DataFrame. This is your column projection tool.filter()orwhere(): Used to choose a subset of rows that meet a specific condition. This is your row selection tool.
You'll often chain these operations together. For instance, to get the order_id and amount for all sales greater than $100:
# Select specific columns and filter rows based on a condition
high_value_sales = sales_df.select("order_id", "amount") \
                           .filter(sales_df["amount"] > 100)

# The show() action triggers the execution
high_value_sales.show()
PySpark Transformations and Actions | show, count, collect, distinct, withColumn, filter, groupby
The following clip from the same video provides a practical demonstration of how to apply filters with single or multiple conditions.
Watch from 10:10 to 12:20. Notice how you can combine multiple conditions using standard logical operators.
B. Grouping and Aggregating Data (groupBy, agg)
This is one of the most powerful operations for summarizing data. The process follows a pattern known as "Split-Apply-Combine":
- Split: The data is partitioned into groups based on the values in one or more columns.
- Apply: An aggregate function (like
count,sum,avg,min,max) is applied to each group independently. - Combine: The results from each group are combined into a new DataFrame.
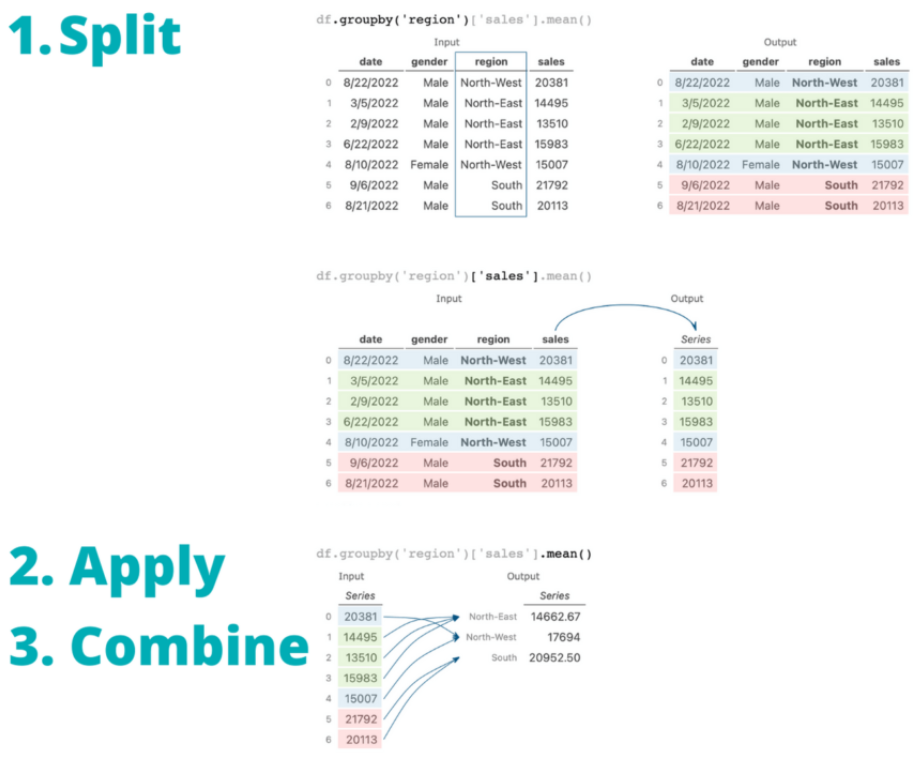
To find the total sales amount per customer, you would do:
# Import aggregate functions
from pyspark.sql.functions import sum, avg, count

# Group by customer_id and calculate the sum of 'amount'
customer_totals = sales_df.groupBy("customer_id") \
                          .agg(sum("amount").alias("total_sales"))

# The alias() function renames the resulting aggregate column
customer_totals.show()
C. Joining DataFrames (join)
Joining is how you combine columns from two or more DataFrames based on a related column between them. This is identical to the JOIN concept in SQL.
Imagine you have another DataFrame, customers_df, with customer_id and customer_name. To enrich your sales data with the customer's name:
# Assume customers_df exists with columns "customer_id" and "customer_name"
sales_with_names = sales_df.join(customers_df, on="customer_id", how="inner")

# The 'on' parameter specifies the join key.
# The 'how' parameter specifies the join type (inner, left, right, full_outer).
# 'inner' is the default.

sales_with_names.show()
PySpark on AWS EMR: A Guide to Efficient ETL Processing
The article 'PySpark on AWS EMR: A Guide to Efficient ETL Processing' provides excellent, concise code examples for these core transformations.
Please read the section titled 'Data Transformation and Cleaning'. Focus on subsection 4, 'Data Transformation', which shows examples of Filtering, Aggregations, and Joining DataFrames.
Test your understanding!
You have two DataFrames:
transactions_df: with columnstransaction_id,product_id,units_sold.products_df: with columnsproduct_id,category,price.
Write a PySpark code snippet to find the total revenue (units_sold * price) for each product category, but only for products in the 'Electronics' category. The final output should have two columns: category and total_revenue.
Show answer
from pyspark.sql.functions import sum, col

# 1. Join the two DataFrames on product_id
enriched_df = transactions_df.join(products_df, "product_id")

# 2. Filter for the 'Electronics' category
electronics_df = enriched_df.filter(col("category") == "Electronics")

# 3. Calculate the revenue for each transaction
revenue_df = electronics_df.withColumn("revenue", col("units_sold") * col("price"))

# 4. Group by category and sum the revenue
final_df = revenue_df.groupBy("category") \
                     .agg(sum("revenue").alias("total_revenue"))

final_df.show()

# A more chained version would look like this:
final_df_chained = transactions_df.join(products_df, "product_id") \
    .filter(col("category") == "Electronics") \
    .withColumn("revenue", col("units_sold") * col("price")) \
    .groupBy("category") \
    .agg(sum("revenue").alias("total_revenue"))

final_df_chained.show()
3. A Practical EMR ETL Example
Now, let's see how these transformations come together in a real script that you would run on an EMR cluster. A common pattern is to read raw data from an S3 bucket, apply a series of transformations, and write the cleansed, processed data back to another S3 bucket.
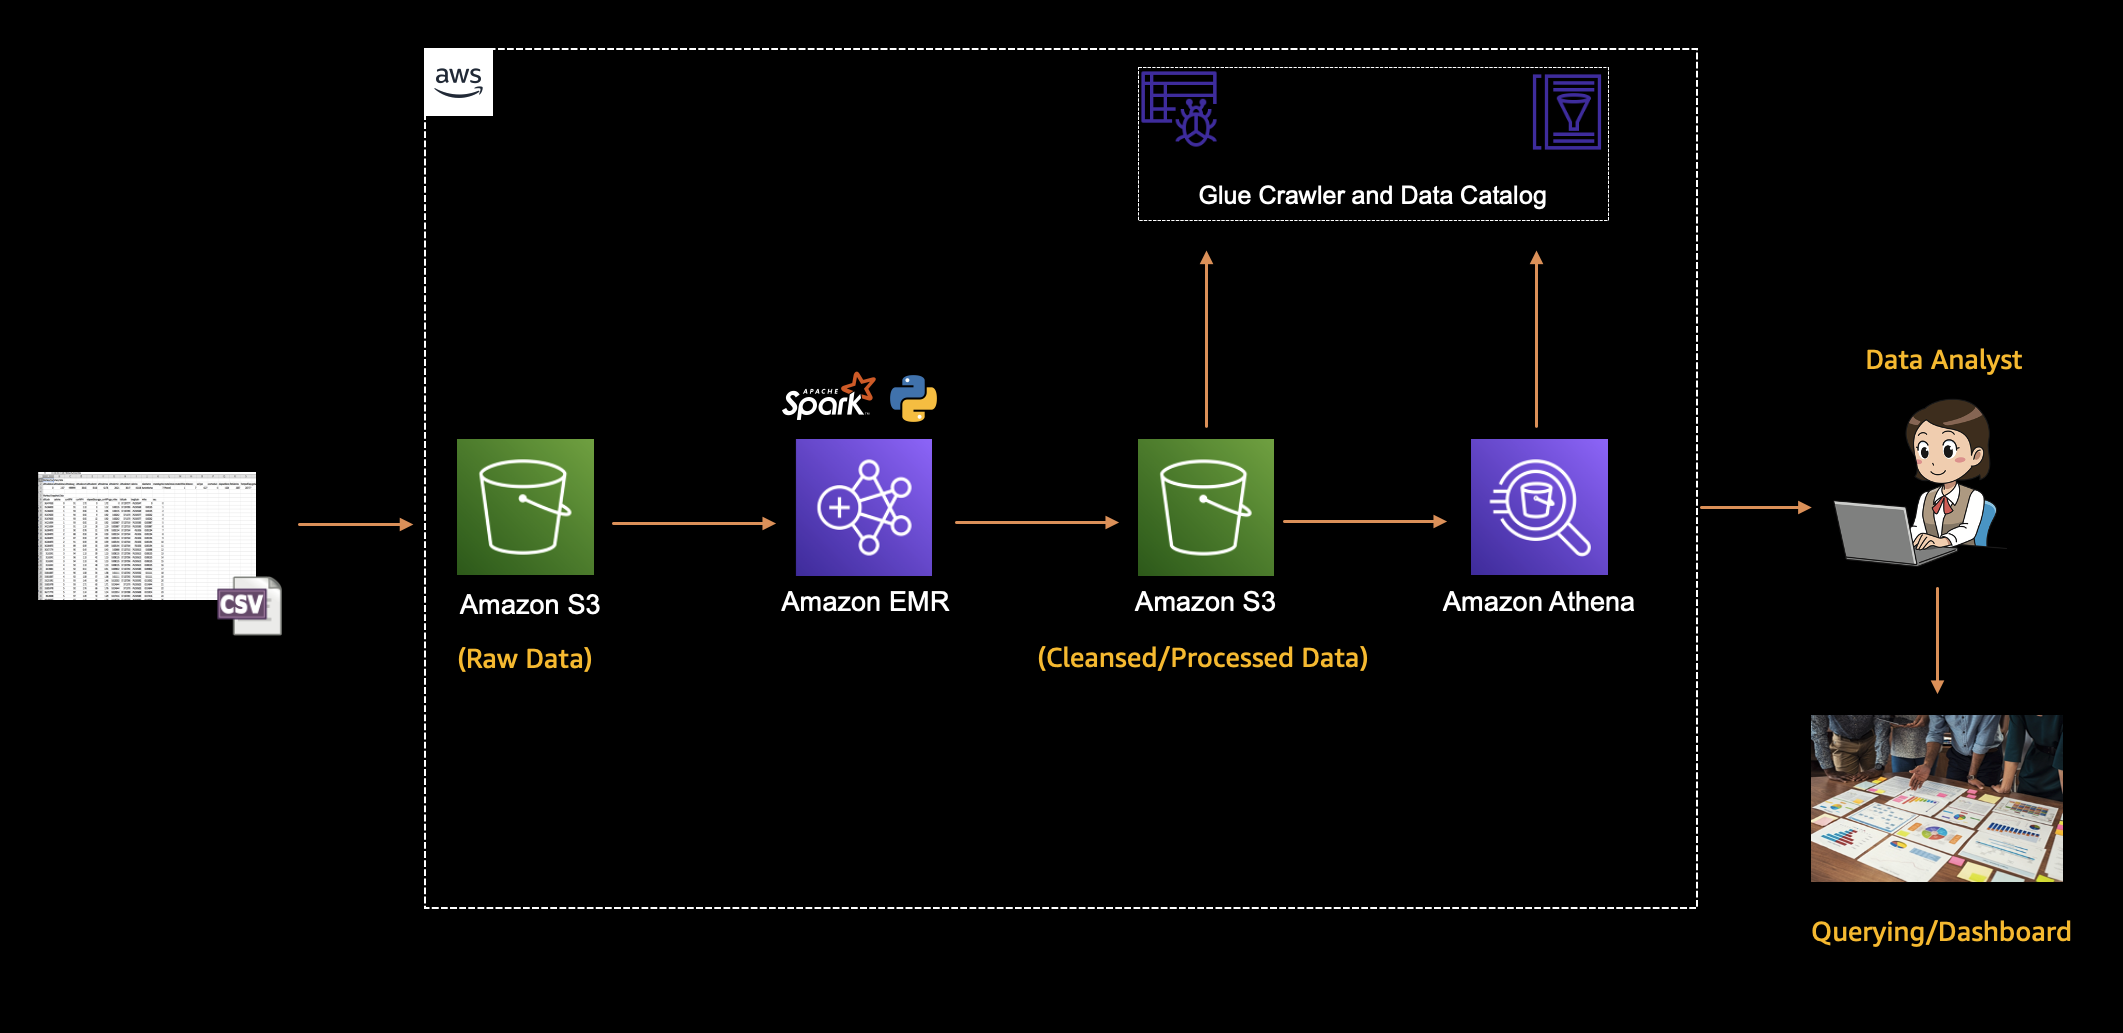
The following video provides a fantastic end-to-end demonstration. It shows the process of writing a PySpark script that reads a CSV, performs transformations, and then submits that script to an EMR cluster to be executed.
Intro to Amazon EMR - Big Data Tutorial using Spark
Let's watch a segment of 'Intro to Amazon EMR' by jayzern. This will show you how to structure a simple PySpark script for an ETL job.
Watch from 09:02 to 13:35. Pay attention to how the script is structured: creating a SparkSession, loading data, renaming columns (a form of select/projection), and using Spark SQL to perform a group by and count (an aggregation). This is a very common and effective pattern.
After writing the script, you need to run it on the cluster. The simplest way to do this is by submitting it as a "Step" through the EMR console. A step is a unit of work that contains instructions to be executed by the cluster.
Intro to Amazon EMR - Big Data Tutorial using Spark
Now, let's see how to take the script from the previous clip and run it on our EMR cluster.
Watch from 13:35 to 15:00. This part shows how to upload your script and data to S3, and then configure an EMR 'Step' to execute the spark-submit command, passing the S3 paths for your script and data as arguments.
Conclusion
In this lesson, you've moved up the stack from infrastructure to application. You now understand the fundamental principles of writing a PySpark application and have seen how to perform the most common data transformations.
Key Takeaways:
- PySpark applications are built around a
SparkSessionand operate on distributed DataFrames. - Operations are divided into lazy Transformations (e.g.,
filter,join) and eager Actions (e.g.,show,count). - The core transformations for most ETL jobs are
select(for columns),filter(for rows),groupBy/agg(for summarization), andjoin(for combining datasets). - A common workflow is to write a PySpark script, upload it to S3, and execute it on an EMR cluster using a Step.
Next Up:
You've now seen how to write a script and submit it as a step. But what happens when things go wrong, or when you need to understand why a job is slow? In our next lesson, we will focus on how to "Submit a Spark application to an EMR cluster and monitor its execution using the Spark UI." We'll dive into the tools EMR provides for tracking job progress, diagnosing failures, and analyzing performance.