Hello! Welcome back to our course on AWS data engineering.
In our previous lessons on Amazon EMR, you've learned how to configure clusters with different applications for both batch processing (Spark) and interactive SQL querying (Hive/Presto). We've focused on what EMR can do. Now, we'll shift our focus to how well it's doing it.
This lesson addresses the learning outcome: Identify performance bottlenecks in EMR Spark jobs by analyzing job history and logs. This is a critical skill for any data engineer, as optimizing job performance directly translates to faster data delivery and significant cost savings. We will explore the primary tools for this diagnostic work: the Spark UI and EMR logs.
1. Your Diagnostic Toolkit: Spark UI and EMR Logs
When a Spark job on EMR runs slowly or fails, you need a way to look "under the hood" to understand what went wrong. Your two main tools for this are:
- The Spark UI: A web interface built into Spark that provides a wealth of information about job execution, resource usage, and performance metrics. It's your X-ray into the application.
- EMR & CloudWatch Logs: While the Spark UI shows you what happened, logs often tell you why. They contain detailed error messages, stack traces, and application output that are essential for debugging failures.
Accessing the Spark UI on EMR
You can access the Spark UI in two ways, depending on whether the job is running or completed:
- For Running Jobs: Navigate to your EMR cluster in the AWS console, go to the "Application user interfaces" tab, and click the link for the "Spark UI". This gives you a live view of the job's progress.
- For Completed Jobs: EMR automatically saves Spark's event logs to a specified S3 location. The Spark History Server, accessible from the same "Application user interfaces" tab, reads these logs and reconstructs the Spark UI, allowing for post-mortem analysis.
Running Spark jobs on Amazon EMR Serverless
The following video clip demonstrates how to access both the live Spark UI for a running job and the Spark History Server for a completed one on EMR. While this demo uses EMR Serverless, the principle and the UI itself are identical for EMR on EC2.
Watch the two short segments: from 05:19 to 05:49 to see how the Spark History Server is launched for a completed job, and from 15:15 to 15:44 to see the live Spark UI for a running job.
2. A Systematic Analysis with the Spark UI
The key to effective bottleneck analysis is a systematic approach. Instead of guessing, you'll use the Spark UI to follow the evidence. The UI is organized into tabs, each offering a different perspective on your application.
To get a comprehensive tour of these tabs and what to look for, the following video is an excellent guide. We will break it down tab by tab.
Spark UI Explained Spotting Bottlenecks & Optimizing Speed #apachespark #dataengineering
This video, 'Spark UI Explained' from Data Architect Studio, provides a practical walkthrough of the Spark UI's most important tabs. We will use it as our primary guide for this section.
First, watch from 01:10 to 01:54 to get an overview of what the Spark UI is and the types of bottlenecks it helps you identify.
Now, let's dive into the most critical tabs for performance tuning.
Jobs Tab: The High-Level Overview
This is your starting point. It shows all the jobs triggered by your Spark application.

What to look for:
- Long Duration: Sort the completed jobs by duration. The longest-running job is your primary candidate for optimization.
- Failed Jobs/Stages: Any job with failed stages or tasks needs immediate investigation.
- Event Timeline: This visualization shows executor activity and job execution over time. Gaps in the timeline can indicate resource contention or issues with the driver.
Spark UI Explained Spotting Bottlenecks & Optimizing Speed #apachespark #dataengineering
Let's see how to analyze the Jobs tab.
Watch from 02:12 to 04:05. Pay close attention to how to identify long-running jobs and what the event timeline reveals about executor activity and potential delays.
Stages Tab: Pinpointing the Bottleneck
Once you've identified a slow job, the Stages tab is where you'll spend most of your time. A stage is a group of tasks that can be executed together without a data shuffle.
What to look for:
- Duration: Just like with jobs, sort stages by duration to find the slowest one.
- Shuffle Read/Write: These are critical metrics. A large shuffle means a lot of data was moved across the network between executors, which is a very expensive operation. This often points to inefficient joins or aggregations.
- Task Details & Event Timeline: The stage detail page has its own event timeline for tasks. Look for straggler tasks—tasks that take much longer than the median. This is a classic sign of data skew.
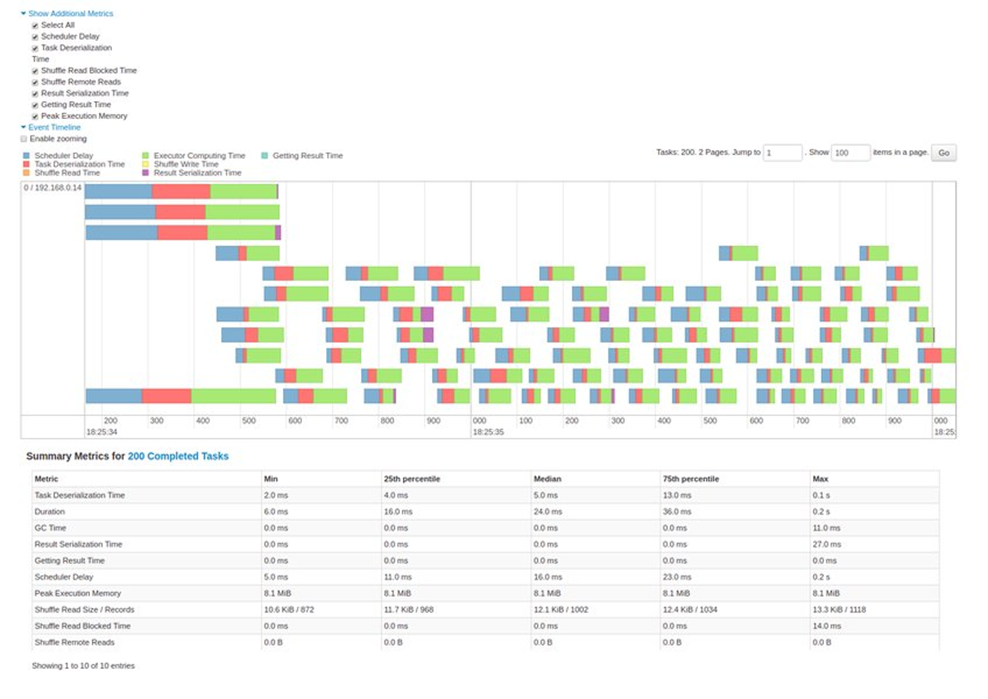
Spark UI Explained Spotting Bottlenecks & Optimizing Speed #apachespark #dataengineering
Now, let's dig into the Stages tab, which is crucial for finding the root cause of a slow job.
Watch from 04:05 to 06:07. Focus on how to spot data skew using the event timeline and the importance of shuffle metrics and garbage collection (GC) time.
Executors Tab: Analyzing Resource Usage
This tab gives you a summary of each executor's activity, which is essential for diagnosing resource-related issues.
What to look for:
- Shuffle Read/Write per Executor: Uneven distribution here is another strong indicator of data skew. If one executor is doing most of the work, the parallelism of your cluster is wasted.
- GC Time: High Garbage Collection time means the executor is spending a lot of time cleaning up memory instead of doing work. This signals memory pressure.
- Storage Memory: If you are caching data, this shows how much memory is used. If it's too high, it leaves less memory for execution, which can lead to tasks spilling data to disk (a major performance hit).
- Logs: This tab provides direct links to the
stdoutandstderrlogs for each executor, which is incredibly useful for finding specific error messages.
Spark UI Explained Spotting Bottlenecks & Optimizing Speed #apachespark #dataengineering
The Executors tab helps you understand how resources are being used across the cluster.
Watch from 07:51 to 09:15. Notice how you can identify GC issues and data skew by comparing metrics across different executors.
SQL / DataFrame Tab: Optimizing Queries
If your application uses Spark SQL or DataFrames, this tab is a goldmine. It shows you the query plan for each SQL operation.
What to look for:
- Query Plan (DAG): This visualization shows the logical steps Spark takes to execute your query. Look for unexpected or inefficient operations.
- Exchange (Shuffle): The plan will explicitly show "Exchange" operations wherever a shuffle occurs. If you see an exchange where you don't expect one, or if it's shuffling a huge amount of data, that's a target for optimization.
- Join Types: Check if Spark chose the right join strategy. For example, if you're joining a large table with a small one, a Broadcast Join is ideal. If the UI shows a SortMergeJoin with a massive shuffle, you've found a key bottleneck.
Spark UI Explained Spotting Bottlenecks & Optimizing Speed #apachespark #dataengineering
Finally, for Spark SQL jobs, the SQL/DataFrame tab is your best friend for understanding query execution.
Watch from 09:15 to 11:26. Pay attention to how the query plan visualization can reveal inefficient operations and how Adaptive Query Execution (AQE) can automatically handle issues like skew.
Test your understanding!
You are analyzing a slow Spark job in the Spark UI. In the Stages tab, you notice one stage takes 45 minutes while all others take less than 2 minutes. Within that slow stage, you observe that most tasks finish in about 30 seconds, but one task runs for over 40 minutes. Which tab would you check next to confirm your primary suspicion, and what specific metrics would you look at?
Show answer
The symptom described (one very long "straggler" task) is a classic sign of data skew.
The best tab to check next is the Executors tab. You would look at the Shuffle Read or Input Size columns and sort by them. You would expect to see one executor with significantly higher values than all the others, confirming that it received a disproportionately large partition of data to process.
3. Connecting UI Symptoms to Common Bottlenecks
After gathering evidence from the Spark UI, the next step is to map the symptoms to a root cause. The following article provides an excellent deep dive into this process and serves as a great reference.
A Deep Dive into Spark UI for Job Optimization
To consolidate what we've learned and connect it to concrete solutions, please read the following article. It provides a detailed, tab-by-tab breakdown and a practical guide to optimization.
First, read the section 'Deciphering the Spark UI: A Tab-by-Tab Analysis' to get a detailed textual summary of what we just covered in the video. Then, focus on the 'Table of Common Symptoms and Proven Fixes' at the end of the 'Optimizing for the Future' section. This table is an excellent study guide for the exam, as it directly links UI symptoms to root causes and solutions.
Here is a summary of the most common bottlenecks and their UI symptoms:
| Bottleneck | Common Symptoms in Spark UI |
|---|---|
| Data Skew | • One or a few "straggler" tasks in the Stage Event Timeline. • Uneven metrics (Shuffle Read/Write, Task Time) in the Executors tab. |
| Excessive Shuffle | • High Shuffle Read/Write values in the Stages tab. • Multiple Exchange operations in the SQL plan. |
| Memory Pressure | • High GC Time in the Task or Executor details. • Disk Bytes Spilled > 0 in the Task details. |
| Inefficient I/O | • High Input size in the Stages tab. • Long Scheduler Delay if reading many small files (list operations can be slow). |
| Inefficient Query | • SortMergeJoin used instead of an expected BroadcastJoin in the SQL plan. • Filter operations happening after a join/shuffle instead of before. |
4. When the UI isn't Enough: Using Logs
Sometimes a job fails outright without providing enough information in the UI. This is when you turn to the logs. On EMR, the driver and executor logs (stdout, stderr) are automatically sent to CloudWatch Logs and also archived in S3.
You can access them directly from the Spark UI's Executors tab, which is often the quickest way.
Running Spark jobs on Amazon EMR Serverless
Let's see a quick demonstration of accessing executor logs directly from the Spark UI.
Watch from 07:51 to 08:28. This shows how to find and view the standard output and standard error logs for both drivers and executors.
These logs are where you'll find critical errors that YARN (EMR's resource manager) reports, such as:
java.lang.OutOfMemoryError: Java heap space: The executor ran out of memory. This corroborates seeing high GC time or spills in the UI.Container killed by YARN for exceeding memory limits. Exit code is 137: YARN forcefully terminated your container because it used more memory than was allocated. This is a very common error.ExecutorLostFailure: The driver lost its connection to an executor, possibly because the node it was on failed or became unresponsive.
Troubleshoot failed Spark jobs in Amazon EMR
The following AWS Knowledge Center article catalogs common Spark job failures on EMR and their causes, many of which you'll discover in the logs.
Scan through the 'Application failures' section. You don't need to memorize every detail, but familiarize yourself with the error types, especially 'Container exit code 137' and 'ExecutorLostFailure', as they are frequently encountered.
Finally, don't forget that EMR also emits cluster-level metrics to CloudWatch, which can help you see broader trends in CPU, memory, and disk utilization across your entire cluster.
Conclusion
In this lesson, you've learned a systematic process for diagnosing performance issues in your EMR Spark jobs. This evidence-based approach, centered on the Spark UI and supplemented by logs, is far more effective than guesswork and is a hallmark of a proficient data engineer.
Key Takeaways:
- The Spark UI is the primary tool for analyzing Spark job performance, accessible for both running and completed jobs on EMR.
- A systematic workflow (Jobs -> Stages -> Tasks -> Executors) helps you drill down from a high-level problem to a specific root cause.
- Be on the lookout for key symptoms of common bottlenecks like data skew (straggler tasks), expensive shuffles (high Shuffle Read/Write), and memory pressure (high GC time, disk spills).
- EMR and CloudWatch logs are essential for diagnosing outright failures, providing specific error messages like
OutOfMemoryErrororExit code 137.
Next Up:
We've now covered the essentials of large-scale data processing with EMR. In our next module, we will transition to the world of analytical databases and data warehousing. The first lesson will be: "Design a Redshift cluster architecture, selecting appropriate node types and sizes." We'll explore how to provision and configure Amazon Redshift, AWS's petabyte-scale data warehouse service, for optimal query performance.