Hello, and welcome back. In our previous lesson, we established the organizational blueprint for a modern delivery model, focusing on Team Topologies as a framework for structuring teams around microservices and managing cognitive load. You learned how to design the "who" of the transformation with stream-aligned, platform, enabling, and complicated-subsystem teams.
Today, we transition from design to execution and measurement. Having a new organizational design is one thing; implementing it successfully and knowing if it's working is another. This lesson directly addresses that challenge by focusing on two critical components: defining robust performance metrics and planning a structured, phased rollout of the new operating model. For your goal of leading large-scale transformation, mastering these two areas is essential for demonstrating value, managing risk, and sustaining momentum.
Part 1: Measuring What Matters in Delivery Performance
To paraphrase management expert Peter Drucker, "You can't improve what you don't measure." In a transformation, metrics are your guidance system. They tell you if your changes are having the desired effect, help you justify investment, and allow you to make data-driven decisions instead of relying on gut feelings.
However, not all metrics are created equal. Your experience in software delivery has likely exposed you to traditional measures like lines of code, man-hours, or team velocity (story points). These are often misleading and can even drive the wrong behaviors.
To understand why these old metrics fall short and to get an introduction to a more powerful, evidence-based approach, please watch this segment of the "Measuring Software Delivery With DORA Metrics" presentation.
Measuring Software Delivery With DORA Metrics
This video from the Modern Software Engineering channel critiques traditional software development metrics and sets the stage for a more effective framework.
Watch the section from the introduction of DORA metrics. The speaker explains why metrics like lines of code and velocity are flawed and can be easily gamed, a crucial context for appreciating the value of the DORA framework.
The DORA Metrics: A Balanced Framework
The DevOps Research and Assessment (DORA) group, now part of Google, conducted years of research involving over 31,000 professionals to identify the key metrics that predict high-performing organizations. The result is a set of four metrics that balance speed and quality. These are not just arbitrary numbers; they are scientifically validated indicators of delivery performance.
The DORA metrics are divided into two categories: Throughput (speed) and Stability (quality).
To learn the specifics of each metric, please review the following article from Planview.
DORA Metrics: Guide to Measuring Software Delivery Performance
This article provides clear, concise definitions for each of the four DORA metrics.
In the article, find the section titled "What Are the Four DORA Metrics?" and read the detailed descriptions for each one: Deployment Frequency (DF) Lead Time for Changes (LT) Mean Time to Recovery (MTTR) Change Failure Rate (CFR)
Let's summarize the key relationships:
| Category | Metric | What It Measures |
|---|---|---|
| Throughput | Deployment Frequency | How often you successfully release to production. |
| Throughput | Lead Time for Changes | How long it takes from code commit to production release. |
| Stability | Change Failure Rate | The percentage of deployments causing a production failure. |
| Stability | Mean Time to Recovery | How long it takes to restore service after a failure. |
The crucial insight from the DORA research is that elite performers do not trade speed for stability. They excel at both. The practices that enable high throughput (like small batch sizes and automation) are the same ones that lead to high stability.
It is critical to view these four metrics as a balanced set. Optimizing for throughput alone will inevitably degrade quality, increase failure rates, and ultimately slow you down as teams become bogged down by bug fixes and rework.
Connecting Delivery Metrics to Business Outcomes
DORA metrics provide a powerful lens on your engineering team's performance, but as a transformation leader, you must connect this to broader business objectives. How does a lower lead time translate to competitive advantage? How does a better change failure rate impact customer trust?
Two excellent frameworks for bridging this gap are Flow Metrics and OKRs (Objectives and Key Results).
The article on DORA metrics you just read also provides a great introduction to Flow Metrics.
DORA Metrics: Guide to Measuring Software Delivery Performance
This resource explains how Flow Metrics complement DORA by focusing on business value.
Read the sections on Flow Metrics. Pay attention to how metrics like Flow Velocity (how much value is delivered) and Flow Distribution (what kind of work is being done—features, defects, risk, debt) provide a business-centric view.
Flow Metrics help you answer questions like, "Are we spending too much time fixing bugs (debt) and not enough time building new features?" This gives you a direct link between delivery activity and strategic priorities.
Similarly, you can use the OKR framework to align team-level DORA metrics with high-level business objectives.
The ultimate guide to Agile transformation - Kiplot
This guide from Kiplot shows how to set strategic OKRs and defines common agile success metrics.
First, read the section on strategic OKRs. Notice how an Objective like "Increase Speed to Market" can have a Key Result like "Reduce the time required to deliver new products or features by 50%". Your DORA metric, Lead Time for Changes, would be the direct measure for this Key Result. Then, browse the section on Key Metrics, where you'll see DORA metrics like Lead Time and Cycle Time listed alongside business-focused metrics like Customer Satisfaction and Innovation Rate.
By using OKRs, you create a clear line of sight from the daily work of your delivery teams to the strategic goals of the entire organization.
Part 2: Planning a Phased Rollout
With a new operating model designed and a set of metrics to measure success, the next question is: how do you implement it? A "big bang" transformation, where everyone changes at once, is exceptionally risky. It assumes your design is perfect from the start and can overwhelm the organization. A more prudent and agile approach is a phased rollout.
There are three common paths for transformation, as illustrated below. While a "Big Bang" might be appropriate for low-complexity, high-urgency changes, the "Pilot First" or "Agile Rollout" approaches are far more common for complex operating model transformations.
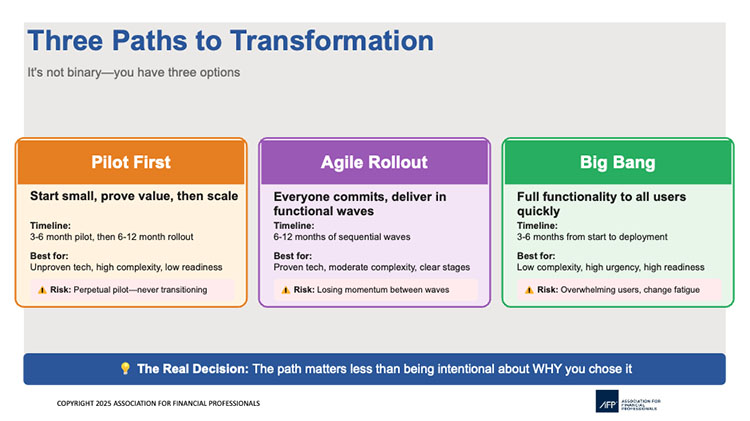
A well-structured phased approach typically involves three stages: Pilot, Scale, and Enterprise-Wide Adoption.
The ultimate guide to Agile transformation - Kiplot
This guide provides a detailed breakdown of a three-phase transformation roadmap.
Please read the sections describing the three phases of transformation: Phase 1: Pilot Projects Phase 2: Scaling Agile Phase 3: Enterprise-Wide Adoption
Phase 1: The Pilot - Proving the Model
The pilot phase is your laboratory. You select one or two teams to test the new operating model in a controlled environment. The goal is not perfection; it's learning.
A key success factor for any pilot is defining what "good enough" looks like before you start. This prevents "analysis paralysis" and ensures you have clear criteria for deciding what to do next.
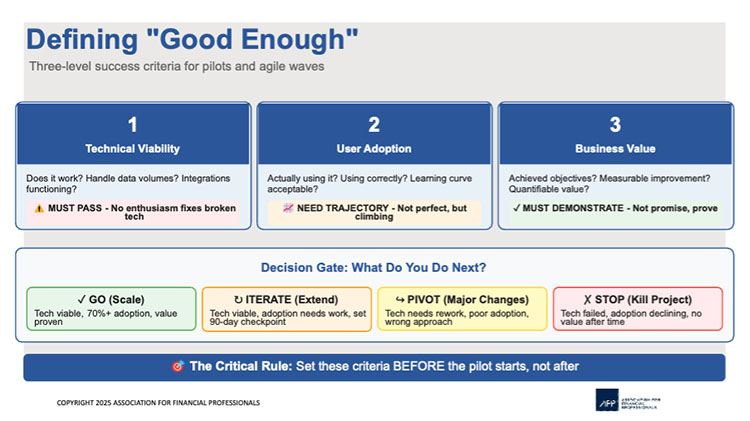
As the image shows, you need to assess the pilot on multiple dimensions:
- Technical Viability: Does the new process work? Are the tools functioning? This is a non-negotiable "must pass."
- User Adoption: Are people actually following the new model? Is the learning curve acceptable? You're looking for a positive trajectory, not perfection.
- Business Value: Did the pilot achieve its intended goals? Did your DORA metrics improve? You must demonstrate quantifiable value.
Based on these outcomes, you make a conscious decision:
- Go (Scale): The pilot was a success. Time to expand.
- Iterate (Extend): The pilot showed promise but needs refinement. Extend the pilot with a new checkpoint.
- Pivot (Major Changes): The core idea was flawed. The tech failed, or adoption was poor. A major rethink is needed.
- Stop (Kill Project): The pilot demonstrated that the approach provides no value. It's better to fail fast and learn than to continue investing in a bad idea.
Documenting the New Model: The Operating Model Canvas
When you launch a pilot, you need a clear way to communicate what the new operating model entails for that specific team. The Operating Model Canvas is an excellent tool for this. It translates your high-level design into a concrete, one-page summary.
This video provides a great overview of the canvas and a practical case study showing how it's used.
Operating Model Design in Successful Digital Transformation
This video explains the components of the Operating Model Canvas and demonstrates its application through a case study of a mental health association transforming its onboarding process.
First, watch the segment that introduces the Operating Model Canvas, which details its six components (value streams, inputs, locations, organization, systems, and management). Then, watch the case study. Observe how the organization maps its current and target state processes and uses the canvas to define the new roles, systems, and metrics required for the transformation.
Using a tool like the Operating Model Canvas for your pilot teams ensures that everyone involved has a shared understanding of the new ways of working, the technologies they will use, and how their success will be measured.
Conclusion
In this lesson, we've equipped you with the tools to measure and implement your new delivery operating model. You've moved from the architectural design of teams to the practicalities of execution.
Here are the key takeaways:
- Measure with balance: Use the four DORA metrics (Deployment Frequency, Lead Time for Changes, Change Failure Rate, MTTR) to get a holistic view of delivery performance, balancing throughput and stability.
- Connect to strategy: Link delivery metrics to business goals using frameworks like Flow Metrics or OKRs to demonstrate the strategic value of your transformation.
- Roll out in phases: Mitigate risk and build momentum by implementing the new operating model through a Pilot, Scale, and Adopt sequence.
- Define success upfront: For any pilot, establish clear, multi-dimensional success criteria (e.g., technical viability, user adoption, business value) before you begin, enabling objective decisions about the future of the initiative.
We have now covered the design, measurement, and implementation of the internal delivery transformation. In our next lesson, we will pivot to the external impact of these changes. We will begin to analyze how a shift to microservices and AI reframes the value proposition for your B2B customers, setting the stage for transforming your go-to-market strategy.