Hello! Welcome to the final module of your capstone project. In our last lesson, you successfully integrated the save and load commands, making your text adventure game functionally complete. The player can now explore, interact with the world, and persist their progress.
This lesson marks the transition from "it works" to "it is correct and robust." We begin the final quality assurance phase, a critical step in any professional software project. Our first tool for this audit will be the GNU Debugger, GDB. You will learn to use GDB to systematically hunt for and eliminate logic errors—subtle bugs in your code's behavior that a compiler can't catch. This process is about ensuring that your game not only runs but behaves exactly as intended under all conditions.
What is a Debugger?
Before we dive in, let's clarify the role of a debugger. Think of it as a diagnostic tool that gives you superpowers over a running program. While your game is executing, a debugger like GDB allows you to:
- Pause the program at any line of code.
- Execute the code step-by-step, one line at a time.
- Inspect the values of any variable or expression at any moment.
- Examine the call stack to see the chain of function calls that led to the current point.
- Modify variables on-the-fly to test different scenarios.
Essentially, it provides a window into the live, internal state of your program, making it an indispensable tool for understanding complex logic and tracking down bugs.
Compiling for Debugging
To use GDB effectively, you must first compile your program with debugging information. This is done by adding the -g flag to your gcc command.
gcc -g -Wall -Wextra -std=c11 main.c game.c player.c -o mygame
This -g flag instructs the compiler to include "debugging symbols" in the final executable. These symbols are extra data that map the compiled machine code back to your original source code's function names, variable names, and line numbers. Without them, GDB would only be able to show you raw memory addresses and assembly instructions, which is far less helpful.
For a deeper understanding of why these symbols are crucial, the following video segment provides an excellent explanation.
An Introduction to GDB for Debugging C Programs - COMP211 - Fall 2020
Watch this segment from Kris Jordan's "An Introduction to GDB for Debugging C Programs" to understand the importance of the -g flag and what debugging symbols are.
Focus on the explanation between this timestamp. The lecturer clearly distinguishes between a standard compilation and one intended for debugging, which is a foundational concept.
The GDB Interactive Session
Once you have a debug-enabled executable, you can start a GDB session from your terminal:
gdb ./mygame
This will launch GDB, loading your program and its symbols. You will be greeted with the (gdb) prompt, ready to accept your commands.
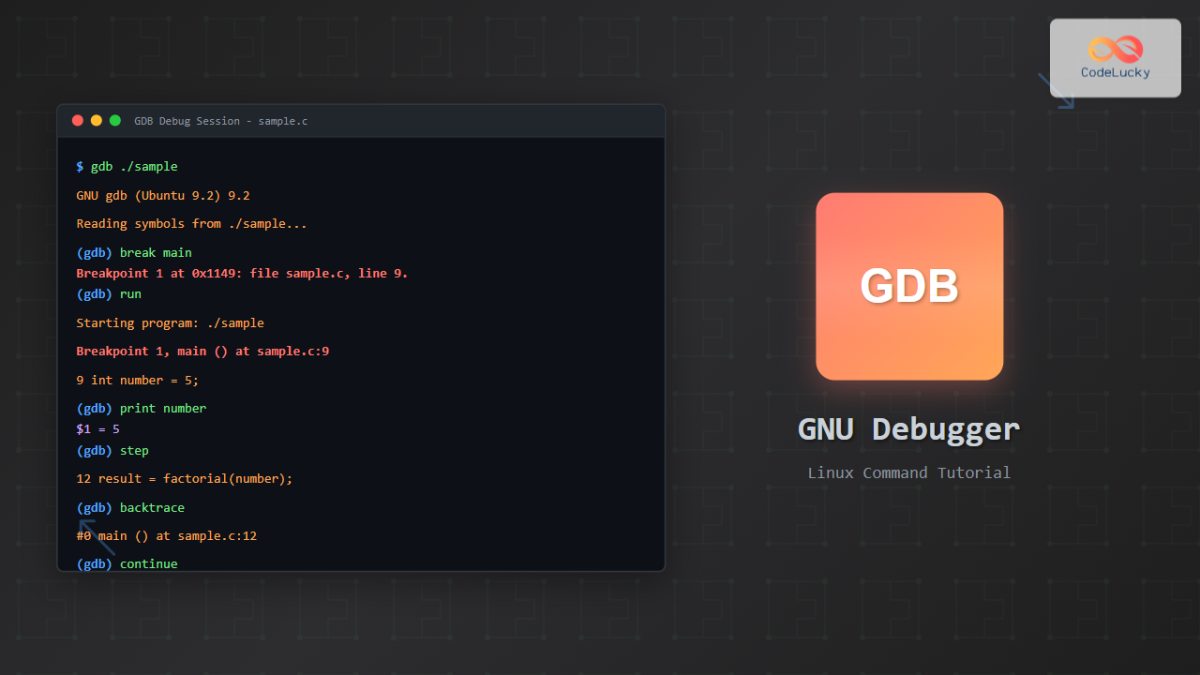
Your program has not yet started running. GDB has simply loaded it and is waiting for your instructions.
Essential GDB Commands
GDB is a command-line tool with a rich set of commands. For our purposes, we'll focus on a core set for navigating and inspecting your code. The resources below provide comprehensive walkthroughs and command references.
This article from "Dive Into Systems" provides a fantastic, step-by-step guide to debugging a buggy C program. It also includes a handy table of the most common GDB commands.
First, review the table of commands to familiarize yourself with the basic vocabulary: break, run, cont, next, step, print, and where. Next, read through the detailed debugging session in the section titled "Example Using GDB". Follow along as the author uses the commands you just learned to set a breakpoint, run the program, and inspect variables to find the source of incorrect output.
Let's consolidate the most critical commands into two categories: Navigation (controlling program flow) and Inspection (viewing program state).
Navigation Commands
break <location>(orb): Sets a breakpoint. The program will pause before executing this line. A location can be a line number (b 25) or a function name (b main).run(orr): Starts the program from the beginning. It will run until it hits a breakpoint or the program finishes.continue(orc): Resumes execution from the current paused location until the next breakpoint is hit.next(orn): Executes the current line and pauses on the next line in the same function. If the current line is a function call, it executes the entire function without stepping inside.step(ors): Executes the current line. If the line contains a function call, it will pause at the first line inside that function.finish: Executes the rest of the current function and pauses after it returns to the caller. Useful if you accidentallystepinto a function you don't care about.
Inspection Commands
print <expression>(orp): Evaluates and prints the value of a variable or expression. You can print simple variables (p myVar), array elements (p arr[3]), or even dereference pointers (p *player).info locals: Displays all local variables in the current function's stack frame.info args: Displays the arguments passed to the current function.backtrace(orbt): Shows the call stack—a list of all active function calls. This is invaluable for figuring out how your program arrived at its current state, especially after a crash.layout src: A very useful command that splits your terminal to show the source code alongside the GDB prompt, highlighting the current line of execution.
A Practical Demonstration: Unraveling a Logic Bug
Reading about commands is one thing; seeing them in action is another. The most effective way to learn GDB is to watch it solve a non-trivial problem. The following video presents a C program with a subtle bug caused by an uninitialized variable, leading to bizarre and unpredictable behavior. This is a classic C pitfall that compilers often won't flag as an error, and it's the perfect candidate for a debugger.
An Introduction to GDB for Debugging C Programs - COMP211 - Fall 2020
In this video, Kris Jordan demonstrates how a seemingly simple C program can behave in completely unexpected ways and then uses GDB to methodically uncover the root cause.
First, watch the demonstration of the problem from the beginning to see the strange output the buggy program produces. Next, see how GDB is used to investigate. Watch the segment from here, where the presenter uses start, step, next, and finish to trace the program's execution and pinpoint the exact moment the logic goes wrong. Note how the return value of the max function is unexpectedly 100 on its second call. Finally, watch the detailed explanation of why the bug occurs from this point. The walkthrough of the call stack and leftover "garbage values" is a perfect illustration of the low-level memory concepts you're aiming to master.
This example powerfully demonstrates that a debugger doesn't just show you what is wrong, but helps you understand why it's wrong, deepening your understanding of how C manages memory on the stack.
Advanced Techniques for Efficient Debugging
Stepping through a program line by line can be slow. For larger projects like your capstone, you need more targeted techniques.
-
Conditional Breakpoints: What if a bug only appears on the 50th iteration of a loop? You can set a breakpoint that only triggers when a certain condition is true.
(gdb) break my_function if i == 50The program will now run at full speed and only pause at
my_functionif the variableiis equal to 50. -
Watchpoints: What if a variable is being changed to an incorrect value, but you don't know where it's happening? A watchpoint tells GDB to pause whenever a variable's value changes.
(gdb) watch player.healthThe debugger will now break execution the moment
player.healthis modified, showing you the old and new values and the line of code responsible.
Both of these powerful techniques are demonstrated in the following video.
9.2 - Debugging - GDB Tutorial
This GDB tutorial by Chris Bourke shows how to use breakpoints and watchpoints to efficiently track down bugs in loops.
Observe how a standard breakpoint is set and used from this segment. Then, see the power of the watch command from this segment to automatically track changes to a variable within a loop, quickly identifying a logic error.
Applying GDB to Your Capstone Project
Now, it's time to apply these skills to your own project. Your task is to perform a systematic debugging pass. Don't just look for crashes; look for any behavior that is not exactly what you intended.
Here is a suggested workflow:
- Compile with
-g: Ensure your Makefile uses the-gflag for all compilations. - Start a GDB Session:
gdb ./your_game_executable. - Audit Command by Command: For each player command (
go,look,take,drop,save,load):- Set a breakpoint at the start of its handler function (e.g.,
(gdb) break executeTake). runthe game and type the command.- When the breakpoint hits, use
nextto step through the handler. - At each step, use
printto check the values of key variables. Is the player pointer valid? Is the item being moved correctly added to or removed from the right linked list? Are location pointers being updated as expected? - Test edge cases. What happens if you try to
takean item that doesn't exist? Orgoin a direction with no exit? Step through the logic and confirm it handles these cases gracefully.
- Set a breakpoint at the start of its handler function (e.g.,
Your goal is to be methodical. Treat your code with professional skepticism. By stepping through each logical branch, you can gain high confidence in its correctness.
Conclusion
You now have a powerful new tool in your arsenal. GDB is the standard for low-level debugging in the C/C++ world, and proficiency with it is a hallmark of an experienced systems programmer. By moving beyond printf debugging, you can diagnose issues faster and gain a much deeper insight into your program's execution.
Key Takeaways:
- Always compile with the
-gflag to include debugging symbols. - The core GDB workflow involves setting
breakpoints, usingrunandcontinueto navigate between them, and usingnext/stepfor fine-grained control. - Inspection commands like
print,info locals, andbacktraceare your window into the program's live state. - For efficiency, use conditional breakpoints and
watchpoints to target specific scenarios or unexpected variable changes.
Next Steps:
In our next and final lesson, we will complete our quality audit by turning our attention from logic errors to memory errors. You will learn to use Valgrind, another professional-grade tool, to hunt for memory leaks, invalid reads/writes, and other dangerous memory-related bugs, ensuring your capstone project is not only correct but also safe and stable.