Welcome to the final lesson of your C course and the capstone project. In the previous lesson, you mastered the GNU Debugger (GDB) to perform a thorough logic audit of your text adventure game, ensuring that every command behaves exactly as intended. You learned to step through your code, inspect its state, and hunt down subtle bugs that a compiler would miss.
This lesson completes our two-part quality assurance process. Having addressed the logical correctness of your program, we now turn to its memory integrity. We will use Valgrind, a professional-grade tool designed to detect memory management and threading bugs. While GDB helps you find out if your program is doing the right thing, Valgrind helps you find out if it's doing it safely. For a systems programmer, this distinction is paramount. By the end of this lesson, you will be able to conduct a comprehensive memory safety check on your capstone project, hunting down memory leaks and invalid memory accesses to make your game robust and stable.
The Dangers of Memory Errors
Before diving into the tool, let's clarify the problem it solves. In C, you are given direct control over memory, which is powerful but also perilous. Memory errors are some of the most insidious bugs in systems programming because they often don't cause an immediate crash. Instead, they can lead to silent data corruption, unpredictable behavior, and security vulnerabilities that are notoriously difficult to trace back to their source.
The article below from "Dive Into Systems" provides an excellent overview of the types of memory errors that can plague a C program and explains why they are so hard to find without a specialized tool.
3.3. Debugging Memory with Valgrind
This article introduces the common types of memory errors Valgrind is designed to find.
Read the introduction, which covers the main categories of errors: the error types. Pay close attention to the description of why these errors are so difficult to debug manually, as described in the paragraph starting here.
Introducing Valgrind's Memcheck
Valgrind is actually a suite of dynamic analysis tools. The default and most widely used tool is Memcheck, which is what we'll be focusing on. Memcheck runs your program in a virtual machine, meticulously watching every single memory access. This allows it to detect issues that would be nearly impossible to spot by just reading the code or using a standard debugger.
To run your program with Valgrind, you first need to compile it with debugging symbols, just as you did for GDB. The -g flag is crucial because it allows Valgrind to give you precise file names and line numbers in its reports.
gcc -g -Wall -Wextra main.c game.c player.c -o mygame
Then, you can run it through Valgrind with a simple command:
valgrind ./mygame
When Valgrind detects an error, it prints a detailed report.
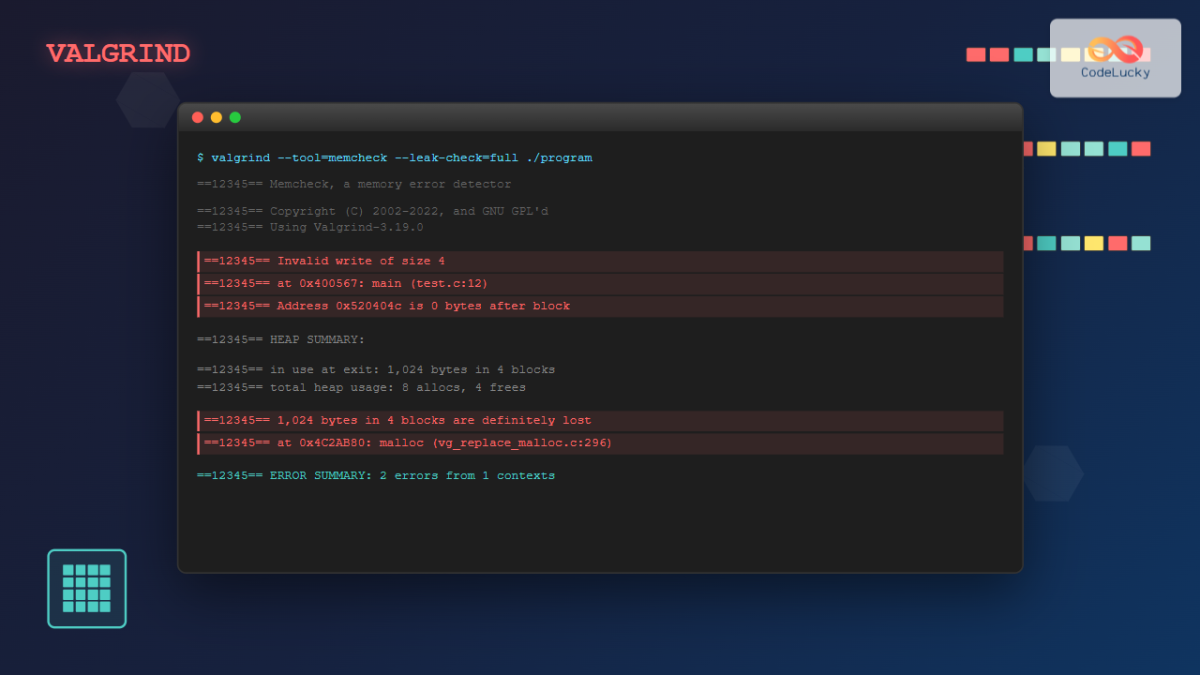
Let's break down how to interpret these reports.
Understanding Valgrind's Output
A typical Valgrind error report gives you three key pieces of information:
- What happened: The type of error (e.g.,
Invalid write,Use of uninitialised value). - Where it happened: A stack trace showing the exact line of code that triggered the error.
- Context: A second stack trace showing where the memory involved in the error was originally allocated (
malloc'd) or freed.
This structure is incredibly powerful because it connects the symptom (the error) directly to its root cause (the allocation).
3.3. Debugging Memory with Valgrind
This section walks through the structure of a Valgrind report in detail.
Read the section titled "How to Use Memcheck". The author provides an example error report and dissects it line by line, explaining the meaning of the process ID, the error type, the stack trace, and the allocation context. This will equip you to read and understand any report Valgrind generates.
A Gallery of Common Memory Errors
The best way to learn Valgrind is to see it in action against common C bugs. The following video demonstrates how Valgrind catches several classic memory errors. Watching these segments will help you build a mental "pattern library" to recognize these issues in your own code.
C Dynamic Memory Debugging with Valgrind
This video, "C Dynamic Memory Debugging with Valgrind" by Brian Fraser, provides clear, self-contained examples of common memory bugs and their corresponding Valgrind reports.
Invalid Write: Watch how an incorrect malloc call leads to an out-of-bounds write, and see how Valgrind precisely identifies it. This segment is a perfect example of a bug that might not crash but causes subtle corruption. Double Free: See what happens when free() is called more than once on the same pointer. Valgrind immediately flags this dangerous operation. Watch from this point. Use-After-Free: This demonstrates one of the most hazardous bugs, where code attempts to use memory that has already been deallocated. Notice how Valgrind's report explicitly states the block "was freed". Watch the demonstration from here.
Another subtle but critical error involves the lifetime of variables. As we discussed in previous lessons, local variables live on the stack and are destroyed when their function returns. Returning a pointer to a local variable is a grave error. While your compiler might warn you, Valgrind will show you the chaotic consequences when that invalid pointer is used.
C Dynamic Memory Debugging with Valgrind
Continuing with the same video, let's see how Valgrind diagnoses issues with stack memory.
Watch the final example from this segment. The presenter returns a pointer to a local array, and Valgrind reports "conditional jump or move depends on uninitialized values" when printf tries to read the garbage data from the reclaimed stack space.
Hunting for Memory Leaks
Besides invalid memory accesses, the other major class of error Memcheck finds is the memory leak. A leak occurs whenever you allocate memory with malloc (or its relatives) but fail to free it before your program loses all pointers to it.
In your capstone project, with its dynamically allocated linked lists for rooms, items, and inventory, leaks are a very real possibility. If you forget to traverse and free every single node when the game ends or a new game is loaded, you will leak memory.
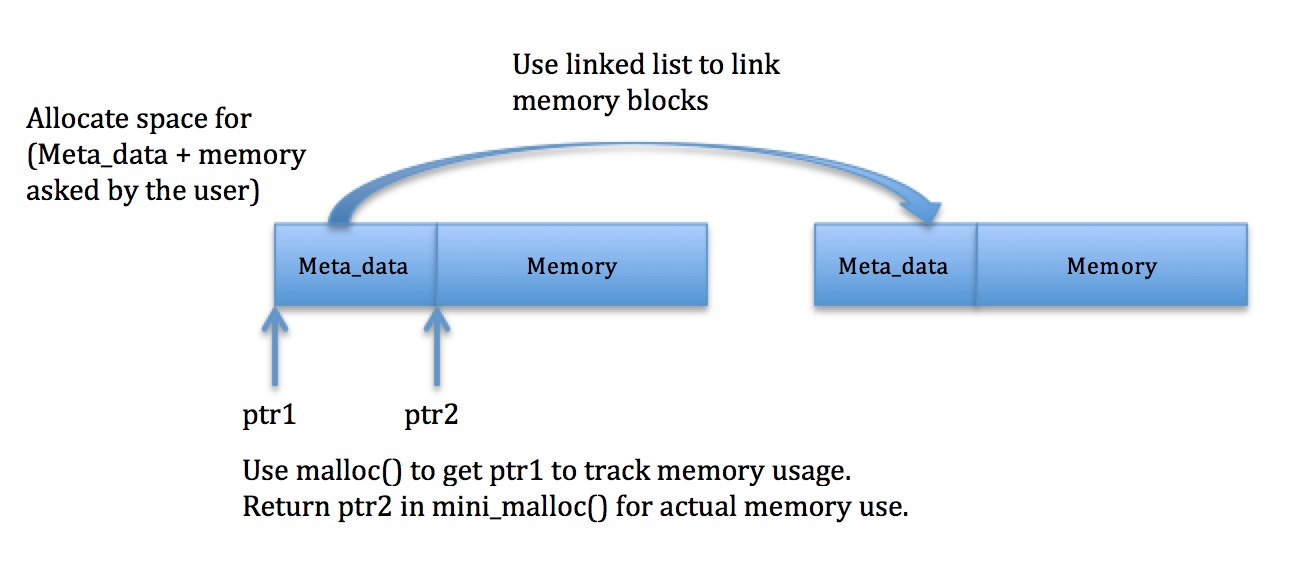
To get the most detailed information about leaks, you should run Valgrind with the --leak-check=full option.
valgrind --leak-check=full ./mygame
This tells Valgrind to show you the exact backtrace of where each leaked block of memory was allocated.
Fix Memory Leaks in C Code with Valgrind
The video "Fix Memory Leaks in C Code with Valgrind" by NeuralNine provides a concise demonstration of creating, detecting, and fixing a simple memory leak.
First, watch the segment from this timestamp to see a basic leak being created with malloc and then detected by Valgrind. Next, see how the --leak-check=full option provides a much more useful report that points directly to the malloc call that caused the leak. Watch from here.
Valgrind classifies leaks into several categories. Understanding these is key to prioritizing your debugging efforts. The following document is an in-depth guide, but we will focus on the most important concepts.
Understanding Valgrind memory leak reports - aleksander.es
This PDF by Aleksander Morgado is the definitive guide to interpreting Valgrind's leak reports. It's detailed, but we will focus on the high-level classifications and the practical advice.
Start by reading the introduction to understand the context of heap vs. stack, and the definition of a memory leak. Read from this section. Next, jump to the section describing the different leak categories. This is the most important part. Read sections 1.4.1 and 1.4.2 to understand the crucial difference between "Still Reachable" and "Definitely Lost". "Definitely Lost" blocks are true memory leaks and are your highest priority. "Still Reachable" blocks are memory that was not freed but could have been (i.e., you still had a pointer to it at exit); this is often acceptable for program-lifetime allocations but can indicate sloppy coding. Finally, read the Conclusion section. It provides a suggested order for fixing leaks, which is an invaluable piece of practical advice for cleaning up a large project.
Your Final Audit: A Capstone Workflow
You are now equipped to perform the final quality audit on your text adventure game. Your goal is to run the game through a complete session and emerge with a clean bill of health from Valgrind: "0 errors from 0 contexts".
Here is your workflow:
- Compile with
-g: Make sure your Makefile is using the debug flag. - Run with Full Diagnostics: Use the most comprehensive set of flags for your Valgrind run. This command enables full leak checking, shows all leak types, and tracks the origin of uninitialized values.
valgrind --leak-check=full --show-leak-kinds=all --track-origins=yes ./mygame - Exercise the Code: Play through a full game session. Start a new game, move between rooms,
takeanddropseveral items,saveyour game,loadit back, and finally, quit. This ensures you test the code paths for allocation, deallocation, and file I/O. - Analyze and Fix: Examine the Valgrind report at the end.
- First, fix all critical errors: Address any
Invalid read/write,Use of uninitialised value,Invalid free()etc. These are more dangerous than leaks. - Then, fix the leaks: Following the advice from the PDF, start with the "definitely lost" and "indirectly lost" blocks. These are your real leaks. Your primary suspects should be the functions that deallocate your linked lists (
free_inventory,free_world, etc.). Are you sure you are freeing every single node? - Finally, review the "still reachable" blocks. If you have any, decide if they represent intentional, program-lifetime allocations or if they are simply forgotten
free()calls.
- First, fix all critical errors: Address any
Conclusion
Congratulations on reaching the end of your C programming journey and completing your capstone project! By mastering both GDB for logic and Valgrind for memory safety, you've adopted the practices of a professional systems programmer. You no longer need to rely on guesswork or printf statements; you have the tools to systematically diagnose and eliminate any bug, no matter how subtle.
Key Takeaways:
- Valgrind's
Memchecktool is essential for finding dangerous memory errors like invalid accesses and memory leaks. - Always compile with
-gto get detailed, actionable reports from Valgrind. - Prioritize fixing critical errors (e.g., invalid writes) before tackling memory leaks.
- Use
--leak-check=fullto get backtraces for memory leaks. Focus on fixing "definitely lost" leaks first. - A clean Valgrind report is a strong signal that your C program is not only correct but also robust and safe.
What's Next?
You have built a solid foundation in C, mastering pointers, memory management, data structures, and professional-grade tooling. Your text adventure game stands as a testament to these new skills. This project marks the successful completion of the first semester of your ambitious two-year roadmap. The path is now clear for you to venture into the fascinating world of CPU emulation, and beyond that, to C++ and building your own game engine from the ground up. Well done, and good luck on the next phase of your adventure