Introduction
In our last lesson, you expertly refactored our single-file inventory system into a professional, multi-file project with a scalable Makefile. This modular structure is essential for building complex software. However, as programs grow, so do the places where bugs can hide. The question now becomes: how do we hunt down bugs when our code is spread across multiple files?
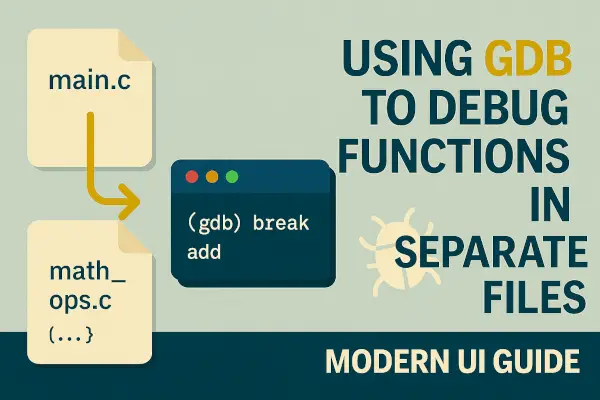
This lesson will answer that question by focusing on debugging multi-file projects. You will learn how to use the GNU Debugger (GDB), both through the Visual Studio Code interface and directly on the command line, to set breakpoints and trace execution flow across different source files. This is a crucial skill that moves debugging from a simple, linear process to a powerful, strategic investigation.
The Foundation: Compiling with Debug Symbols
Before we begin, it's vital to remember a key step from our previous lesson. Our Makefile includes the -g flag in the CFLAGS variable:
CFLAGS = -Wall -Wextra -g
This seemingly small flag is what makes effective debugging possible. It instructs the compiler to embed debug symbols into the final executable. These symbols are a map that links the compiled machine code back to your original source code, including function names, variable names, and line numbers. Without -g, GDB can only show you raw assembly instructions and memory addresses, which is far less practical for finding logic errors.
To see a quick explanation of why this is so important, let's turn to a short video that contrasts a stripped executable with one compiled for debugging.
GDB is REALLY easy! Find Bugs in Your Code with Only A Few Commands
The video "GDB is REALLY easy!" provides a clear, concise demonstration of the importance of debug symbols.
Watch the segment from compiling with debug info. The key takeaway is understanding that the -g flag is the switch that enables GDB to give us a "human readable output" tied to our source code.
Debugging in VS Code: A Practical Walkthrough
For day-to-day development, you'll likely use the integrated debugger in VS Code. It provides a powerful and intuitive graphical interface on top of GDB. Let's walk through setting it up and using it with our multi-file inventory project.
The following video is an excellent, comprehensive guide. We will work through it step-by-step, adapting the concepts to our own project.
C++ Tutorial for Beginners #10: Debugging Makefile Project with Visual Studio Code IDE | (Linux GDB)
This "C++ Tutorial for Beginners" video from SavvyNik provides a complete guide to debugging a Makefile project in VS Code, which applies directly to our C project.
We will break this down into several parts. Configure launch.json: First, watch from the beginning to the initial setup. This shows you how to create a launch.json file. The most important change is setting the "program" path. For our project, this should be "${workspaceFolder}/bin/game", since that's where our Makefile places the final executable. Compile and Set Breakpoints: Skip ahead and watch from setting breakpoints. This part covers two critical actions: Running make in the terminal to ensure your project is compiled with the debug symbols. Setting your first breakpoints by clicking in the gutter next to the line numbers in your source code. For this exercise, set one breakpoint in main.c (e.g., where you call a function to add an item) and another breakpoint inside the corresponding function definition in inventory.c. Master the Controls: Now, review the core debugger controls from debugger controls. This segment explains the "continue" (F5), "step over" (F10), "step into" (F11), and "step out" (Shift+F11) buttons. Understanding the difference between step over and step into is fundamental for navigating multi-file projects. Inspect Program State: The next segment, from inspecting variables, introduces the side panels for Variables, Watch, and the Call Stack. The Call Stack is particularly important, as it shows you the chain of function calls that led to your current position, even across different files. Putting It All Together: Finally, watch a portion of the practical demonstration from a debugging session. Pay close attention to how the presenter uses "step into" to jump from the main function into a function defined in another file, and how the call stack updates to reflect this. Try this yourself: start the debugger, let it hit the breakpoint in main.c, and then use "Step Into" (F11) to jump into your inventory.c function.
By following these steps, you have successfully traced your program's execution across file boundaries. You can see how the debugger seamlessly navigates between main.c and inventory.c, all thanks to the symbol map provided by the -g flag.
Under the Hood: GDB Command-Line Interface
While the VS Code interface is convenient, understanding the underlying GDB commands provides a deeper insight into the debugging process. The GUI is simply sending these text commands to a GDB process behind the scenes.
When debugging from the command line, how do you tell GDB to set a breakpoint in a file other than the one you're currently viewing? The syntax is straightforward.
Peter's gdb Tutorial: Stepping And Resuming
This tutorial page clearly explains the syntax for setting breakpoints in multi-file programs.
Please read the section titled Setting Breakpoints In Multiple File Programs. This introduces the two essential commands: break filename:linenumber and break filename:function. Then, review the Summary Of Breakpoints table, noting Form 3.
To apply this to our project, you would launch GDB from your project's root directory:
gdb ./bin/game
Once inside GDB, you can set breakpoints anywhere in your project's source code:
(gdb) break main.c:50
Breakpoint 1 at 0x1234: file src/main.c, line 50.

(gdb) break inventory.c:add_to_inventory
Breakpoint 2 at 0x5678: file src/inventory.c, line 25.

(gdb) run
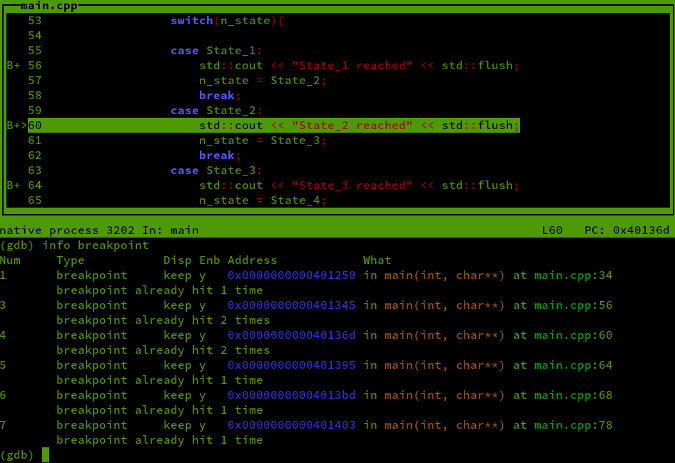
After starting the program with run, GDB will stop at the first breakpoint it encounters. You can then use commands like next (step over), step (step into), and continue to navigate your code, just as you did with the UI buttons. The where command is the text equivalent of the Call Stack window, showing your current location in the function call hierarchy.
Conclusion
You have now equipped yourself with the essential skills to debug C programs of realistic complexity. By understanding how to trace execution across multiple files, you can systematically investigate issues in a well-structured, modular codebase.
Key Takeaways:
- Compile with
-g: This is the non-negotiable first step that embeds the necessary debug symbols into your executable. - VS Code Debugging: The integrated debugger provides an intuitive way to set breakpoints in any source file and navigate between them using controls like "Step Into" (F11).
- The Call Stack: This is your map during a debug session, showing the active function call chain across all files.
- GDB Command Line: For direct control, you can use the
break filename:linenumberorbreak filename:functionsyntax to precisely target breakpoints from the GDB prompt.
In our next module, we will move on to a critical aspect of game development: persistence. You will learn how to use file I/O to save your game state (like the player's inventory) to a file and load it back later, ensuring that progress isn't lost when the program closes.