Welcome to our next lesson. In the previous session, we broke down how to interpret the intercept and slope coefficients of a simple linear regression model as individual components. You now have the templates to explain what and mean separately and are aware of the critical distinction between association and causation.
Today, we will synthesize those two interpretations into a single, comprehensive statement that explains the meaning of the entire regression equation. This is a common exam task that tests your holistic understanding of the model as a predictive tool. We will also cover the final core concept of this module: defining and calculating a residual, which measures the error of a single prediction.
Interpreting the Full Regression Equation
In the previous lesson, you worked with individual coefficients. Now, let's put them together. The simple linear regression equation, , is fundamentally a formula for making predictions. Given a value for the predictor variable , you can calculate the model's best guess for the response variable, .
An exam-style interpretation of the full equation must clearly state this predictive purpose and combine the meaning of both the intercept and the slope. The following reading provides an excellent, concise template for this.
AP® Statistics Review: Linear Regression Models - Albert.io
This resource from Albert.io breaks down the regression equation into its core components and provides clear, exam-ready templates for interpretation. It reinforces the idea of the equation as a "recipe" for prediction.
First, read the section "Understanding the Linear Regression Equation" to solidify the concept of the equation as a predictive formula. Next, focus on the table under "Interpreting the Regression Equation in Context". While this table separates the intercept and slope, we will combine its logic into a single sentence. Pay close attention to the emphasis on using plain English and referencing the actual variables.
The Exam-Style Template
Based on the principles from the reading, here is a robust template for interpreting the full regression equation:
The Template:
"The regression model predicts [Y variable] based on [X variable]. The model estimates a baseline [Y value] of [ value] when [X value] is 0, and for each one-[unit] increase in [X variable], the predicted [Y variable] is expected to [increase/decrease] by [ value]."
Let's apply this to the sales data from our last lesson, where the equation was:Sales = 0.8031 + 0.6929 * No_Ads
Interpretation:
"The regression model predicts sales revenue based on the number of ads run. The model estimates a baseline sales revenue of 0.8031 units when zero ads are run. For each additional ad, the predicted sales revenue is expected to increase by 0.6929 units."
This two-sentence structure clearly defines the model's purpose and integrates the specific meaning of both coefficients in context.
The Prediction Error: Defining Residuals
Now that we know how to use the equation to get a predicted value (), the next logical question is: how good is that prediction? To answer this for a single data point, we calculate the residual.
A residual is simply the difference between the actual, observed value () and the value predicted by the model (). It is the prediction error for a single case.
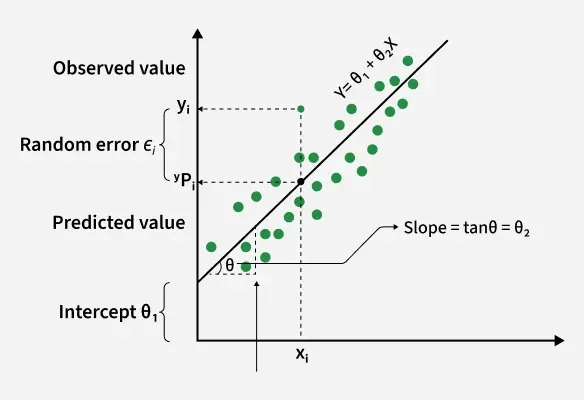
The formal definition is straightforward:
The following reading explains this concept clearly.
Chapter 22 Simple Linear Regression: Continued
This document provides a rigorous yet clear explanation of residuals. We will focus on the definition and interpretation.
In Section 22.1, please read the paragraph that starts with the definition of a predicted response and a residual. Then, jump ahead to Section 22.5 ("Summary") and read the bulleted list that explains how to interpret the sign and magnitude of a residual.
Interpreting a Residual
The sign and size of the residual tell you everything about the prediction error for that specific data point:
- If : This means . The actual value was higher than the prediction. The model under-predicted.
- If : This means . The actual value was lower than the prediction. The model over-predicted.
- If : This means . The model's prediction was perfect.
The larger the absolute value of the residual, the larger the prediction error.
Practice Drill
Let's put this together with an exam-style question. An analysis was run on 10 WNBA players to predict weight based on height.
Given Information:
- The regression equation is:
Weight = -304 + 6.57 * Height - One player is 75 inches tall and has an actual weight of 184 lbs.
Your Task:
- Using the template, write a 2-line interpretation of the full regression equation in context.
- For the player who is 75 inches tall:
a. Calculate her predicted weight using the equation.
b. Calculate her residual and interpret what it means.
Solutions
-
Interpretation of the Equation:
- Answer: "The model predicts a player's weight (in lbs) based on their height (in inches). The model estimates a baseline weight of -304 lbs when height is 0 (an impractical extrapolation), and for each additional inch of height, the predicted weight is expected to increase by 6.57 lbs."
- Note: Acknowledging that the intercept is a nonsensical extrapolation shows a higher level of understanding, which is great for impressing a strict professor.
-
Prediction and Residual:
- a. Predicted Weight:
- b. Residual:
- Interpretation: The residual is -4.75 lbs. This means the model over-predicted this player's weight by 4.75 lbs.
- a. Predicted Weight:
Conclusion
In this lesson, you've learned how to synthesize the meanings of the intercept and slope to interpret the full regression equation as a predictive tool. You also now understand that a residual measures the prediction error for an individual observation.
Key takeaways for your exam:
- Full Equation Interpretation: Combine the baseline prediction (intercept) with the rate of change (slope) into a single, contextual statement.
- Residual Definition: . It is the observed value minus the predicted value.
- Residual Interpretation: A positive residual means the model under-predicted; a negative residual means it over-predicted.
We have now covered all the foundational concepts for interpreting a simple linear regression model. In our next lesson, we will move on to assessing the overall quality of the model by looking at metrics that summarize all the residuals at once: R-squared and the Residual Standard Error.