Welcome to the next lesson in our high-intensity crash course. In our previous session, we mastered the interpretation of dummy variables, seeing how their coefficients represent a simple shift in the intercept between a base category and another category. This created a model with parallel lines for different groups.
Today, we take this a step further to tackle one of the most powerful—and frequently tested—concepts in regression: interaction terms. What happens when the effect of one predictor isn't constant, but actually depends on the value of another? This is the core question an interaction model answers. Instead of parallel lines, we'll now see lines with different slopes, allowing us to model more complex, real-world relationships. Your ability to correctly interpret these models is a crucial skill for the exam.
By the end of this 60-minute lesson, you will be able to interpret every coefficient in a model with an interaction term and explain precisely how the effect of one variable changes depending on the level of another.
What is an Interaction Effect?
An interaction effect occurs when the relationship between a predictor variable and the outcome variable changes based on the level of a second predictor variable.
Think about food and condiments. The enjoyment you get from mustard depends heavily on the food you're putting it on.
- Mustard on a Hot Dog: Great! The effect of "mustard" on "enjoyment" is positive.
- Mustard on Ice Cream: Terrible. The effect of "mustard" on "enjoyment" is very negative.
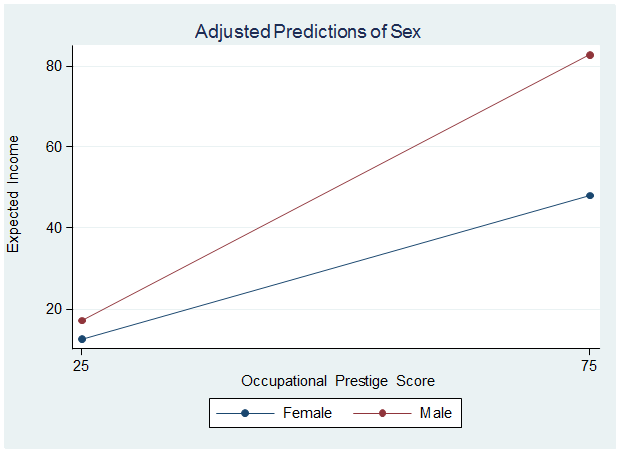
The effect of the condiment (mustard) depends on the food (hot dog vs. ice cream). This is an interaction. Visually, this is represented by non-parallel lines, as you can see in the plot below.

The Model with an Interaction Term
Let's consider a common case you'll see on your exam: the interaction between a continuous predictor (X) and a binary predictor (Z). The model equation is:
Where:
- is our continuous variable (e.g.,
hours_studied). - is our dummy variable (e.g.,
is_private_school, coded 0 for Public, 1 for Private). - is the interaction term.
The key to interpretation is to break this equation down for each category of the dummy variable.
Case 1: For the reference category (Z = 0, e.g., Public School)
If we plug in Z=0, the equation simplifies:
This is a simple linear equation.
- Intercept:
- Slope:
Case 2: For the other category (Z = 1, e.g., Private School)
If we plug in Z=1, we get:
Now, let's group the terms to see the new intercept and slope:
This is also a linear equation, but with a different intercept and slope.
- Intercept:
- Slope:
How to Interpret the Coefficients (Exam Focus)
This is where you earn your marks. Let's define what each coefficient means in this context.
- (Intercept): The predicted value of Y when both X=0 and Z=0 (i.e., for the reference group at the baseline level of the continuous predictor).
- (Main Effect of X): The slope of X for the reference group only (when Z=0). It's the change in Y for a one-unit change in X, specifically for the group where Z=0.
- (Main Effect of Z): The difference in the intercept between the group Z=1 and the reference group Z=0.
- (Interaction Effect): This is the most important one. It is the difference in the slope of X for group Z=1 compared to group Z=0. It tells you how much the effect of X changes when you switch from the reference group to the other group.
Visually, an interaction means the lines representing the relationship for each group are not parallel.
Guided Walkthrough with R Output
Let's solidify this with a real example. The following video gives a great overview of the theory and how to specify the model in R. Pay close attention to how the presenter breaks down the model equation for each category.
Multiple linear regression with interaction in R
This video from the Equitable Equations channel clearly explains how to model and interpret an interaction between a quantitative and a categorical variable in R.
Watch from the start until the end of the main explanation. The key sections are: Specifying the model in R with the * operator. The theoretical breakdown of the model, which shows how b0 and b1 are the intercept/slope for the reference level, and b2 and b3 are the differences. Connecting the R output back to the theoretical model to build the specific equations for each group.
Now, let's apply this to a detailed example from a public health dataset. We will use an excellent online textbook that walks through this step-by-step.
5.10 Interactions | Introduction to Regression Methods for Public Health Using R
This resource provides a clear, practical example of modeling and interpreting an interaction between a continuous variable (Waist Circumference) and a categorical variable (Gender) to predict Fasting Glucose.
Please read the following sections: Start at "5.10.4 Regression equation with an interaction". Read through the model specification and the R output to see the estimated coefficients. Crucially, read the NOTE on interpreting main effects. This is a major exam trap that you must avoid. Finally, read "5.10.4.1 Examining the equation for each gender" to see how the author derives the separate equations for males and females from the main output.
Let's dissect the R output from that reading together.
##                          Estimate Std. Error t value Pr(>|t|)
## (Intercept)                 2.209      0.503   4.396    0.000
## BMXWAIST                    0.040      0.005   8.276    0.000
## RIAGENDRFemale              1.746      0.649   2.690    0.007
## BMXWAIST:RIAGENDRFemale    -0.020      0.006  -3.218    0.001
Here, BMXWAIST is Waist Circumference (continuous) and RIAGENDRFemale is the dummy variable (0=Male, 1=Female).
Exam-Style Interpretation:
BMXWAIST(): For males (the reference group), a 1 cm increase in waist circumference is associated with a 0.040 mmol/L increase in predicted fasting glucose.BMXWAIST:RIAGENDRFemale(): The effect of waist circumference on predicted fasting glucose is 0.020 mmol/L lower for females than for males. The interaction is statistically significant (p = 0.001), so the relationship between waist circumference and fasting glucose significantly depends on gender.
Calculating the Slope for Females:
This directly addresses the second part of our learning outcome. To find the slope for females, we combine the main effect of BMXWAIST and the interaction effect:
So, for females, a 1 cm increase in waist circumference is associated with a 0.020 mmol/L increase in predicted fasting glucose.
Common Exam Trap: Misinterpreting Main Effects
As the reading and video emphasize, when an interaction term is in the model, the main effects cannot be interpreted as overall effects.
- The coefficient on
BMXWAIST(0.040) is not the overall effect of waist circumference. It is only the effect for males. - To state the effect of waist circumference, your answer must specify for which gender. The correct answer is, "The effect of waist circumference on fasting glucose depends on gender."
This next video brilliantly explains this trap and offers a simple way to think about it: to find the effect of a variable, just "gather up" all the terms in the equation that include that variable.
How to Interpret a Regression with an Interaction Term
This video provides a very clear, practical method for finding the effect of one variable when an interaction is present.
Watch the segment from "understand the effect of one variable". The presenter's method of "gathering up the terms" that contain age is exactly the technique you should use to derive the conditional effect of a variable on your exam. He shows that the effect of age is 3 + 1 * white_collar, which is not a single number but an expression that depends on white_collar.
Practice Drill
You are given the following R output for a model predicting student exam_score based on hours_studied, program_type (0=STEM, 1=Arts), and their interaction.
Coefficients:
                             Estimate Std. Error t value Pr(>|t|)
(Intercept)                   55.20       2.10   26.29   <2e-16 ***
hours_studied                  4.50       0.50    9.00   <2e-16 ***
program_typeArts               7.30       3.00    2.43   0.016 *
hours_studied:program_typeArts -1.80       0.75   -2.40   0.017 *
Your Task:
- What is the predicted effect of one additional hour of study on
exam_scorefor a STEM student? - Write a one-sentence interpretation for the interaction term
hours_studied:program_typeArts. - What is the predicted effect of one additional hour of study on
exam_scorefor an Arts student?
Solution
-
For a STEM student (the reference group,
program_type=0), the effect of one additional hour of study is given directly by thehours_studiedcoefficient. The predicted exam score increases by 4.50 points for each additional hour of study. -
The effect of studying on exam scores is 1.80 points lower for students in the Arts program compared to students in the STEM program.
-
To find the effect for an Arts student, we combine the main effect and the interaction effect: . For an Arts student, the predicted exam score increases by 2.70 points for each additional hour of study.
Conclusion
You have just tackled one of the most complex but insightful aspects of linear regression. Mastering interactions separates a basic understanding from an advanced one and is a surefire way to impress on your exam.
Key Takeaways:
- An interaction means the effect of one predictor (X) on the outcome (Y) depends on the level of another predictor (Z).
- In a model , the main effect is the slope of X only for the reference group (Z=0).
- The interaction coefficient is the change in the slope of X when moving from the reference group to the other group (Z=1).
- To find the slope for the non-reference group, you must calculate .
In our next lesson, we will cover the final topic in this module: log transformations. We will explore how they can help us model relationships that aren't linear and fix issues like heteroscedasticity, adding another powerful tool to our regression toolkit.